Bollard Pull Calculations for Towing Operations
Part II – Finding out the maximum feasible tow speed
(To read Part I, please click here)
Introduction
This is Part – II of the two part article on Bollard Pull calculations. In the Part I we saw how to calculate the required Bollard Pull to select a tug. At this stage, we have accomplished the following
- Calculated the required Bollard Pull (BP) to tow the vessel (barge or ship)
- Selected the tug based on the required Bollard Pull
In this part we will see how we can estimate the maximum safe towing speed for the vessel to ply in a given sea state. Before we get to the actual methodology, let’s look at the concept of Available Pull of the tug at non-zero speed.
Concept – Available pull of the tug at non zero-speed
By now we have selected the tug, and it has its rated bollard pull, which is its maximum pulling force at zero forward speed. Let’s call it BPmax. As we saw in Part I, this BPmax should be more than the total required towing force for the STALL condition. However, the actual towing scenario (called the TOW condition) is different in two ways
- First, the tug is not static but towing the vessel forward at a non-zero speed. When the tug moves forward, part of the tug’s power is used in overcoming the resistance of the tug itself, and the rest is actually available to tow the vessel. Let’s say, if Ftug is the force which the tug utilizes for itself, then the available power for towing (BPavailable) will be
BPavailable = BPmax – Ftug
At zero speed, Ftug is zero, and whole BPmax is available for the holding the towed vessel. At the maximum free-running speed of the tug, the whole BPmax is utilized for the tug’s own resistance, and the available power for towing is zero. Thus, if we plot the available towing power of the tug vs speed, we will get a curve like below. The actual curve is not exactly a straight line, but we will assume a straight line to keep things simple (it also leads to more conservative results).
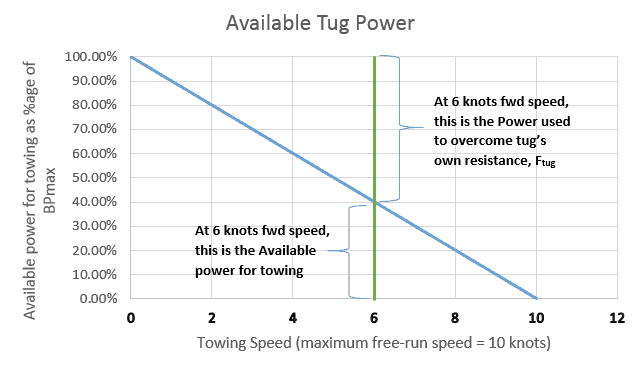
Available Tug Power
In the example above, we can see that at 6 knots towing speed, the maximum available power for towing is only 40% of the BPmax, while 60% goes to overcome the tug’s own resistance
- Second, the environment under which towing is performed is not the same as the STALL environment scenario. Usually, the STALL sea state is a harsher one in which the requirement is to HOLD the tow, and not move it forward. The towing will be done is a comparatively milder environment.
Our objective is to find out the maximum speed which the tug can make in a given environment.
Methodology
The methodology which we are going to follow for the above exercise is outlined below
- Step 1 – Get the environmental parameters under which the towing will be done
- Step 2 – Get the tug particulars
- Bollard Pull at 100% and 85% MCR or other MCR values as required
- Tug maximum forward free run speed
- Step 3 – Plot the tug performance curves for different MCR values
- Step 4 – Calculate the total environmental forces (on the towed vessel) for different speed of towing, beginning from zero speed up to the maximum tug speed
- Step 5 – Plot the curve of Total Environmental force (FTOT) vs towing speed on the same graph as the tug performance curve.
- Step 6 – The intersection of the curves for total environmental force and tug performance will give the limiting towing speed
Let’s now see each step in detail

Step 1 – Get the environmental parameters
The environmental parameters for towing in this case are the maximum wind, current and wave in which the towing operator proposes to tow the vessel. The towing operator has to advise the safe limiting environment in which she/he plans to tow. For example, the operator may decide that a wind of 20 knots, wave of 3 m and current of 1 knots is the limiting environment in which she/he plans to tow the vessel. The operator would like to know the maximum speed she/he can make with this limiting environment.
Step 2 – Get the tug particulars
We saw that the available power for towing keeps reducing with speed of tow. The performance curve of the tug is an important input for determining the available power. For plotting the performance curve, we need the following:
- The free running maximum speed of the tug – this is obtained from the tug’s specifications sheet
- The Bollard Pull of the tug at 100% MCR and 85% MCR. Usually the tug will be operated at 85% MCR. 100% MCR is more significant for the STALL condition to calculate the maximum required Bollard Pull. If the tug is operating at some other MCR value, then the Bollard Pull for that value should also be obtained.
Step 3 – Plot the tug performance curve
Once we have the above data, we can plot the tug performance curves for 100% & 85% MCR (or any other value) using the method described in Section 2.
Step 4 – Calculate the total environmental forces for different tow speeds
- Wind and current forces are calculated using standard formulas described in Part I.
- The wind and current forces will keep increasing as the tow speed increases. This is because the effective (or relative) wind/current speed against the vessel increases as the vessel moves forward. If the speed of the tug is Vtow, and speed of the wind is Vwind, then the effective wind speed is
Veffective = Vtow + Vwind
The wind force will have to be calculated for the above effective speed. Same holds true for the current force
- The wave force is calculated based on DNV-RP-H103 Sec 7.2.6. The wave force also increases with the towing speed, and is calculated in accordance with the relevant sections of DNV.
- Once we have the wind, wave and current forces, we calculate the total environmental force, FTOW by adding them up. FTOW is calculated for different tow speeds from zero to maximum tug speed.
We can do the calculations and present them in a spreadsheet format. Once such calculation table is presented below (speed means towing speed)

Step 5 – Plot FTOT against tug speed on the same plot as for the tug performance curve.
The curve will then look something like the below (the tug’s bollard pull is 150 MT)
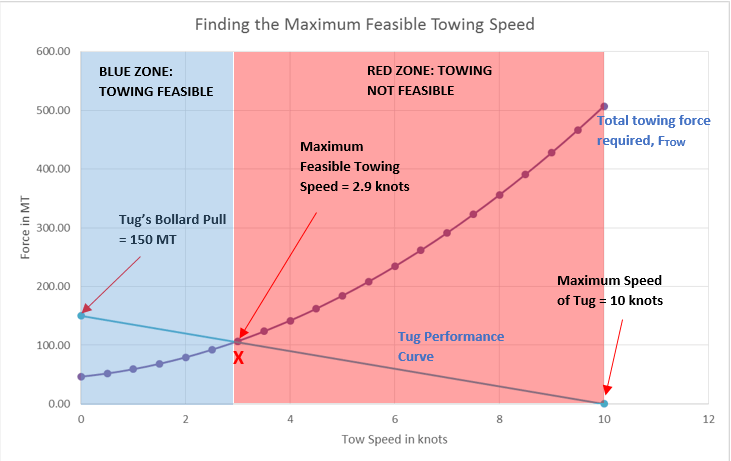
Step 6 – Finding the limiting towing speed
The intersection of the curves for total environmental force and tug performance will give the limiting towing speed. In the above plot, the point ‘X’ is the intersection of the two curves. We can see that at all points to the left of the point ‘X’ (i.e., speeds less than 2.9 knots marked by blue zone), the available towing pull of the tug exceeds the required towing force, thus making the towing feasible. However, to the right of point ‘X’ (the red zone), the available tug power is less than the towing force required and towing is not feasible. Thus the maximum towing speed feasible for this case is 2.9 knots.
Thus we saw how the maximum feasible towing speed can be calculated for towing a vessel under a given environment. This exercise becomes useful when the Client or MWS requires that a minimum towing speed be achieved and demonstrated through calculations.
That brings us to the end of this two-part article on Bollard Pull. We hope it has been useful to our readers. Do let us know your thoughts in the comment section. Happy Towing!!
References
- DNV RP-H103 Modelling and Analysis of Marine Operations
- ABS, 2016, Rules for Building and Classing Mobile Offshore Drilling Units, Part 3 Chapter 1,Section 3, ‘Environmental Loadings’, p.11.
- An Approximate Power Prediction Method, J.Holtrop and G.G.J.Mennen, 1982
- BV – Towage at Sea of Vessels or Floating Units
- OTC 3220, Vol 4, Resistance of Offshore Barges and Required Tug Horsepower
Disclaimer: This post is not meant to be an authoritative writing on the topic presented. thenavalarch bears no responsibility for the accuracy of this article, or for any incidents/losses arising due to the use of the information in this article in any operation. It is recommended to seek professional advice before executing any activity which draws on information mentioned in this post. All the figures, drawings and pictures are property of thenavalarch except where indicated, and may not be copied or distributed without permission.
PS: TheNavalArch has its own products for calculating Bollard Pull required for Barges and Ships. Check them out below.
Approach may be conservative, but really down to earth for practical use in the maritime towing industry.
Thanks for publishing.
just wonder why there is no vessel/barge mass (m) being added in the formula in order to determine the tug bollard pull required.
Hi Shahril
Apologies for the delay in reply. The total pull depends on the resistance experienced by the vessel, which comprises wind, wave and current forces. Wind and current forces depend on the area of the vessel exposed to them, rather than the mass itself. Thus, for the same vessel mass, a vessel with more blunt shape will experience higher resistance compared to one with streamlined shape.
Weight plays no part.
It’s the resistance by water and wind that has to be overcome to break the inertia.
Initial pull by the tug will be the hardest, then as the barge gains momentum lesser pulling force will be required
A floating craft has displacement which is not weight.
Like a yacht or small tug boat can be shoved off with hands
The underwater area when made to move is resisted by water, this resistance has Tobe overcome, and that’s the force to be calculated
What happen if we push the towing speed more than 2.9 knots or we can call it maximum feasible towing?
Hi Rian
You can call it the maximum feasible towing under the given environment of the tow route.
Very useful article. Thanks for posting it!
Hi Thomas
Many thanks for your comments. Please do come back for more posts
in case of a grounded vessel or casualty, it might not always be possible for tow tug to come close to the casualty. my question is does the length of tow line/rope affect tow efficiency?
Hi Parin
Thanks for your query. The length of the towline does have an effect on the tow efficiency. Shorter towlines lead to an effect called ‘propeller race’ that reduces the effective bollard pull available to the tow. Please check out our other article on propeller race:
https://thenavalarch.com/three-simple-but-useful-calculations-when-towing-a-vessel/
can we get a try test
Hi Ahmed
Thanks for your query. At the moment it is not available for trial. You can watch the video to see how the software works. Thanks