LONGITUDINAL STRENGTH OF SHIPS – A GUIDE
Source: http://worldwideflood.com
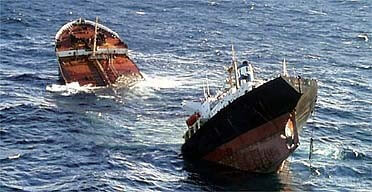
Talking about strength of a ship, the picture that comes to mind is that of a ship being subject to rough weather of the sea, and trying her best not to crack or capsize.
A ship with sufficient strength should be able to bear its self-weight, the weight of its cargo, and also the forces which the sea exerts upon it.
Abbreviations
SF – Shear Force
BM – Bending Moment
Longitudinal/Global vs Local Strength
At the outset, it is useful to know the difference between global and local strength of ships. Longitudinal strength is also called as global strength. Global strength pertains to assessing the strength of the entire ship when it is floating in still water or in waves. Local strength, on the other hand, is about assessing the strength of a localised structure, like a girder or a longitudinal for loads experienced locally. In this article, we will talk about global (or Longitudinal) strength only.
The basic premise – ship as a beam
So, how do we go about assessing the longitudinal strength of a ship?
Here’s the problem statement
I have a ship which is floating in water. It is loaded with cargo, and its tanks are filled depending on the operational requirements (called the loading condition, e.g., ballast departure/arrival OR fully loaded departure/arrival etc.). In the open ocean, it will also experience waves. I want to know whether the ship has sufficient strength to withstand this loading. What do I calculate? What do I check it against?
Put simply, I would like to calculate the forces and moments acting on the ship’s structure because of this loading condition, and check them against the maximum which the ship can take.
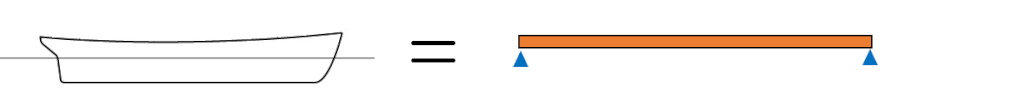
Complicated as it may sound, the basic premise is actually quite simple. The whole ship is considered to behave like a simple beam, and principles similar to a beam are applied to evaluate her strength.
Comparisons to a beam
When we analyse the strength of a beam which is under some load, our final target is to calculate the following forces in the beam
- Shear Force
- Bending Moment
From basic theory of beams, it can be known that the Shear force distribution is a mathematical integration of the load distribution along the length of the beam, while the Bending Moment distribution is the mathematical integration of Shear force distribution along the length of the beam. We will discuss what is integration and how it is done in later sections. To know more about this theoretical formulation, see here.
If the Load, Shear Force and Bending Moment are designated by P, SF and BM respectively, what we have is
SF = ʃ P.dx and BM = ʃ SF.dx (these fancy symbols mean ‘integration’, and are nothing to be overwhelmed with.)
Load, Shear Force and Bending Moment
Similar to a beam, to find out the Shear Force/Bending Moment of the ship, we follow the steps below:
- Find out the load distribution of the Ship along its length
- Integrate the load distribution along the ship’s length to get the Shear Force distribution
- Integrate the Shear force distribution along the ship’s length to get the Bending Moment
At this juncture, several questions arise in our mind –
- What are the loads on the ship?
- What do we mean by load distribution? How to get it?
- What is meant by integrating the load/shear force and how do we do it?
We’ll take them up one by one.
Loads on a ship
If we think from a very basic viewpoint, there are only two kinds of loads on the ship (ignoring external wind/current forces)
- Weight of the ship – acts downwards and distributed over entire length of ship
- Buoyancy force which the water exerts on the ship’s underwater body – acts upwards and distributed over the length of underwater portion of ship
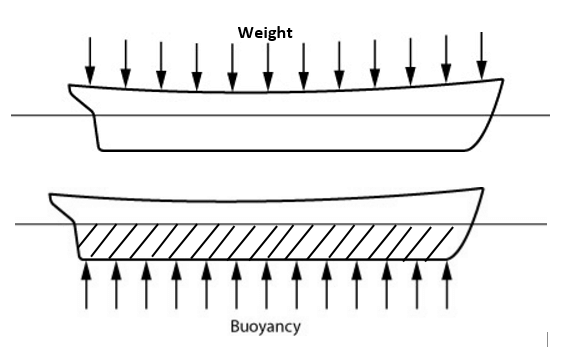
The buoyancy, on the other hand, is the upwards force exerted by water on the ship. When the ship is in equilibrium, its Weight is equal to its buoyancy. The buoyancy force distribution depends on the underwater profile of the ship, which keeps changing because the ship keeps encountering waves of different sizes.Coming to the Weight of a ship – there are different types of weights on the ship. First is the self-weight of the ship, also called the lightweight. It comprises of the ship hull’s structural weight, the weight of machinery and the weight of outfitting (basically, all the items which are unchanging are part of Lightweight). The other type of weight is the Deadweight (DWT). It is the weight of all the changeable items like Cargo, Fuel, Ballast Water, Fresh Water, and all the other items in the ship’s tanks. Together, Lightweight and Deadweight add up to the total weight of the ship called displacement.
Hogging and Sagging
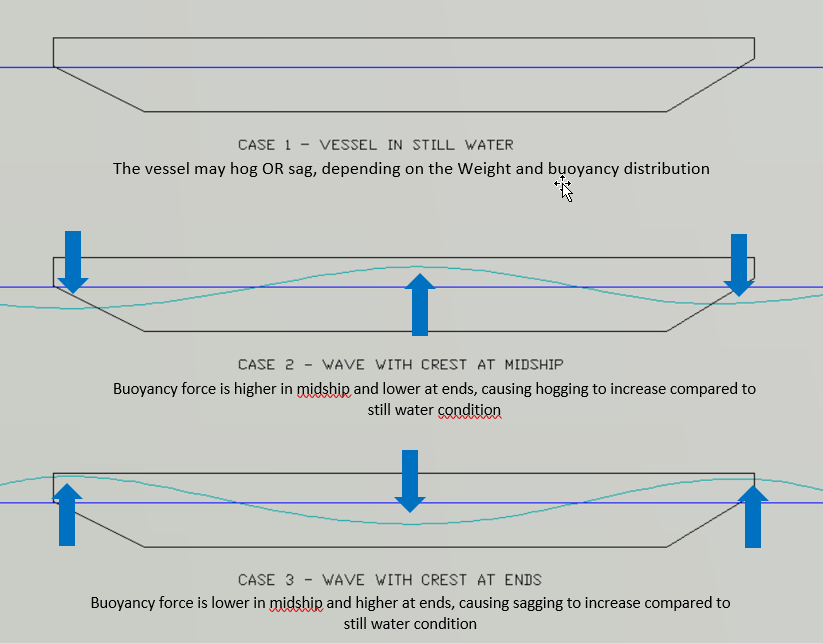
Imagine a ship as a long structure with hollow compartments in between. What happens if I load more at the ends of the ship and less on the midship part? The ends of the ship will bend down, while the middle part will be pushed up, leading to the ship taking the shape of an arch, with the deck being convex, and bottom of the ship being concave. This is called ‘Hogging’ of the ship. Similarly, if the ship is loaded more on the middle and less at the ends, then the midship will go down, while ends will go up, leading to a condition called ‘Sagging’. Hogging or sagging can also be induced by the wave which a ship is encountering. A long wave with crest at the midship and troughs at ends will increase the hogging of the ship (by increasing buoyancy in midship), and a wave with crest at ends and trough at midship will increase Sagging. Hogging and sagging are depicted below. Needless to say, these deflections put stress on the structure of the ship, and the ship structure should be strong enough to bear them.
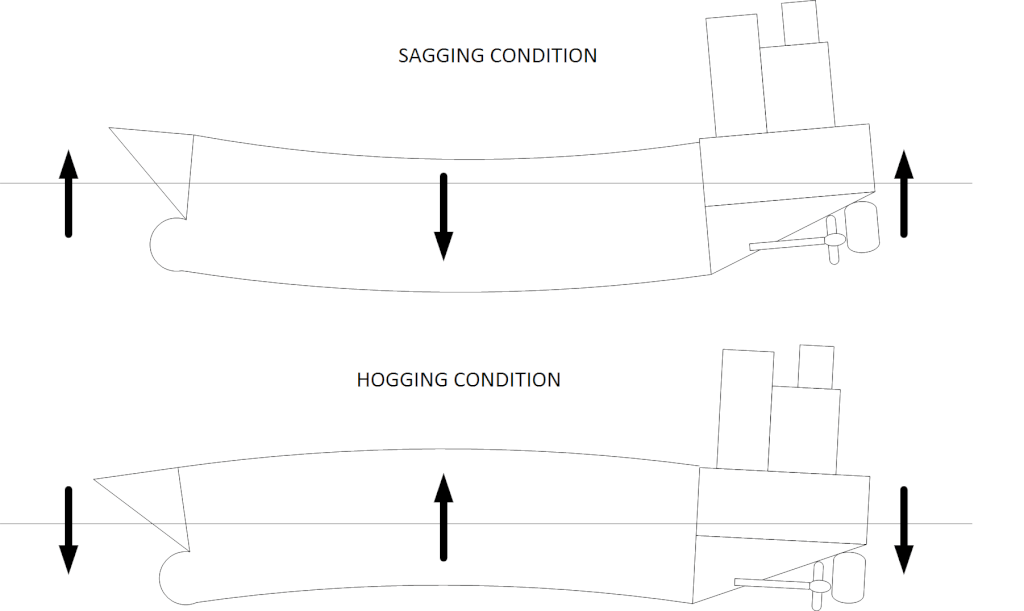
Image Courtesy – Wikipedia
Load Distribution
For the strength calculation, what is more important is not the total load on the ship (which is Total Weight minus Total Buoyancy, and is zero for a ship in equilibrium), but the Load Distribution along the length of the ship. To elaborate, this means how the weight and buoyancy are distributed along the ship’s length. For example, if the machinery of the ship is located aft, then the weight distribution will show heavier weights towards aft. Similarly, if the ship has a fuller bow, then the forward portion of the ship carries more buoyancy, and so the buoyancy distribution will show higher buoyancy in the fwd of the ship.
The load distribution is nothing but the net load plotted at each point along the length of the vessel. Load is the Weight minus Buoyancy at any point along the length of the ship.
Load = Weight – Buoyancy
So, how do we plot the Load Distribution along the length? The three-step process is below:
Step 1 – Plot the weight distribution along the ship’s length
Step 2 – Plot the buoyancy distribution along the ship’s length
Step 3 – Find out the load distribution by subtracting the buoyancy from weight along the length of the ship
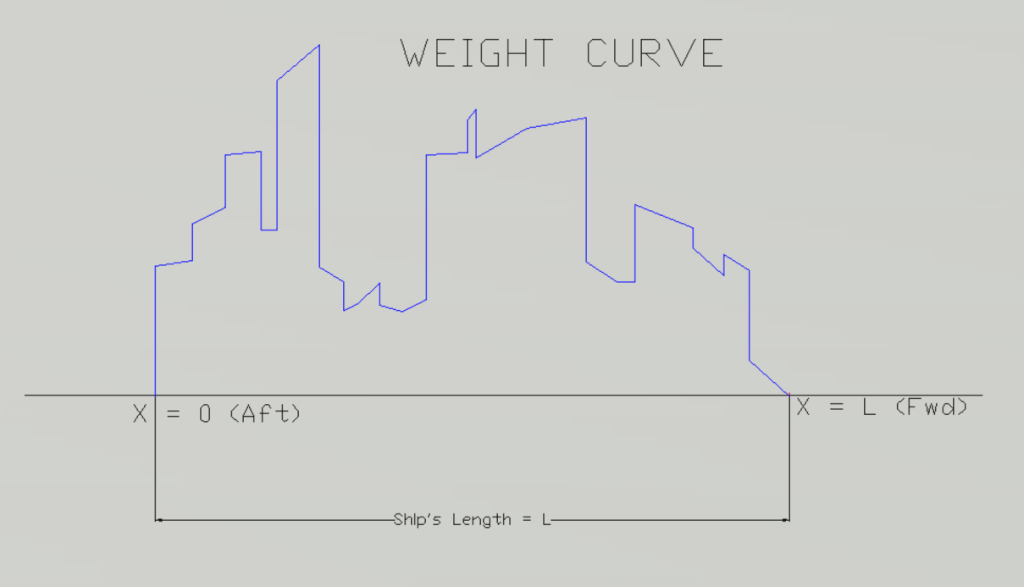
Plotting the Weight Distribution
The basic idea is to plot the load due to weight at each point along the ship’s length. This involves plotting weight distribution of each individual item comprising the ship’s weight at its location along the length of the ship. Now, each item spans over a distance along the ship’s length. Thus, it’s weight is spread over a length. To plot its weight distribution, we need to plot its weight per unit length over the item’s length. The total area of this plot of weight per unit length should be equal to the weight of the body.
The following method is followed to add an item to the Weight distribution
Method to add an item to Weight Distribution
- Find out the Weight (w) and length (l) of the item
- Find out the LCG (Longitudinal Center of Gravity) of the item along the length of the ship
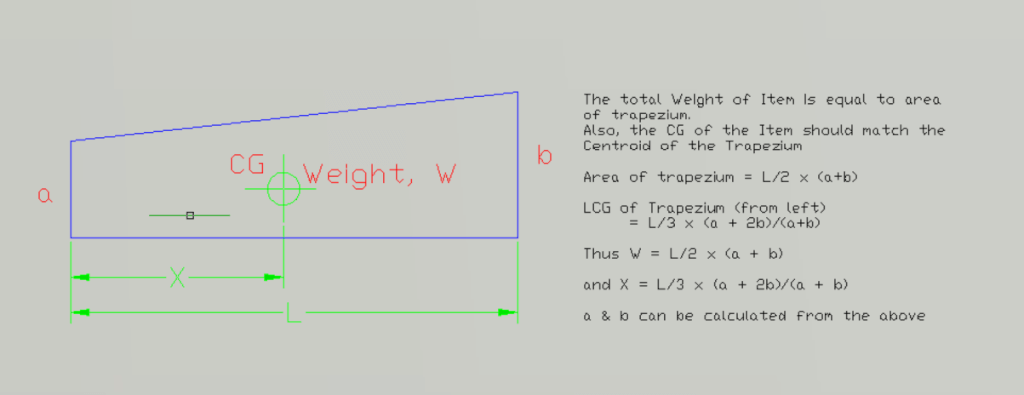
- The weight of the item is considered to be distributed in the shape of a trapezium.
- Find out the ordinates of the trapezium considering following two facts
- The total area of the trapezium should be equal to the weight of the item
- The Centroid of the trapezium should be equal to the LCG of the item
- Plot the trapezium by adding it to the existing Weight distribution
- Keep adding items to the load curve one by one to give the final Weight distribution of the ship
To illustrate the above, let’s assume that we want to add a Deck Cargo which has a weight of 100 tons, is 10 m long, and its LCG is located at midship. Also, its LCG lies 6 m from its own aft end (see figure).
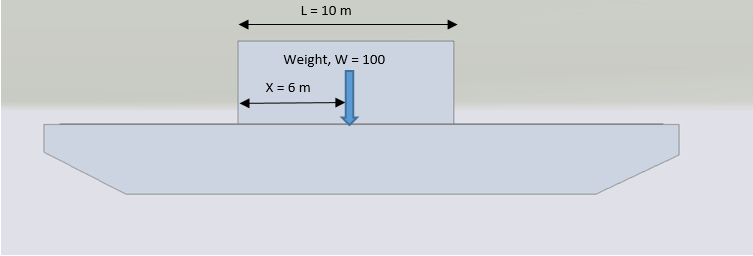
Let’s plot its trapezium. Let the ordinates of the trapezium be a and b. The calculation is demonstrated below
Now that we know how to plot the weight distribution of an item on the ship, let’s take up the individual components of weight of the ship and see how we can plot them.
The Weight of the ship comprises of Lightweight and Deadweight. We’ll take them up one by one
The scare of Lightweight distribution and the way out
The Lightweight, or the self-weight of the ship is comprised of the structural steel weight of the ship’s body, the weight of machinery, and the weight of outfitting (accommodation included).
There are numerous items on the ship, and taking into account each and every item of the ship to prepare the lightweight distribution is a tedious task. The good news is, there are some approximate methods available. These methods create the lightweight curve based on the usual lightweight distribution expected from a regular ship-shaped vessel. Generally, a ship is fuller in the midship region and slimmer at ends. So, the weight distribution is also expected to follow a similar trajectory. A typical lightweight distribution curve is shown below:
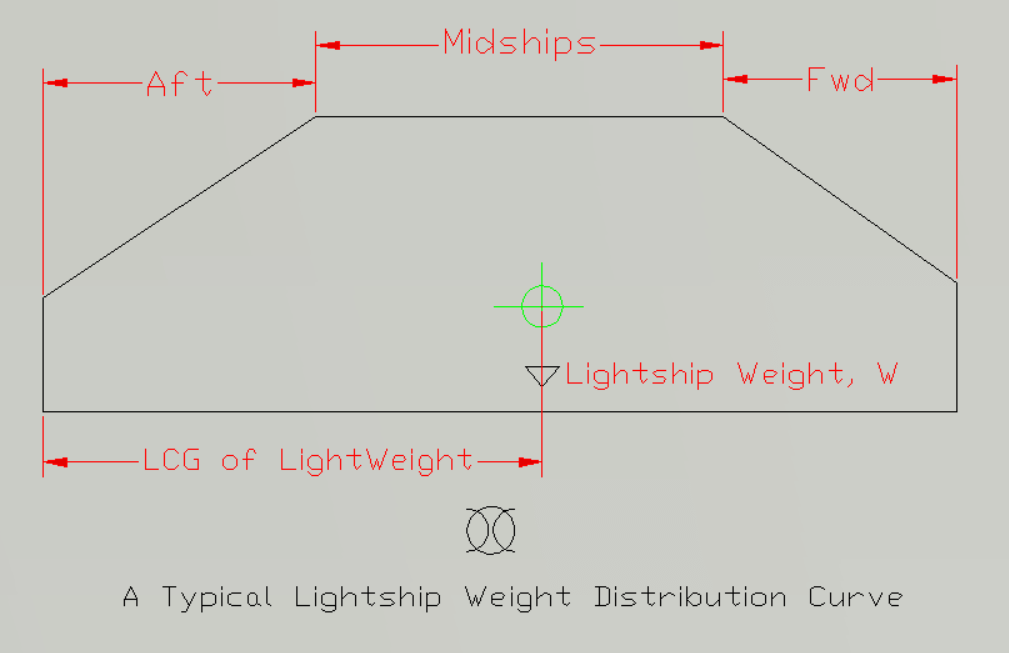
We can see that the curve is constant for midship region, while it tapers towards the ends where weight is less. Lightweight can be plotted using one such simpler method as demonstrated above. For more about methods for lightweight distribution, see here.
Deadweight distribution and adding it to lightweight curve
Once we have the lightweight curve from approximate methods as described above, we need to add the items of deadweight to it to get the total weight distribution curve.
Deadweight comprises of cargo, fuel oil, ballast, fresh water etc (i.e., the variable loads on the ship). To add a deadweight item, we just follow the procedure as described in the beginning of this section by creating the trapezium and adding it to the existing weight curve. In most cases, the load distribution will be a rectangle (both the ordinates of the trapezium will be same), since most deadweight items are uniformly distributed along their geometrical length.
The following pictures illustrate this process of adding the trapezium of an item to the weight curve.
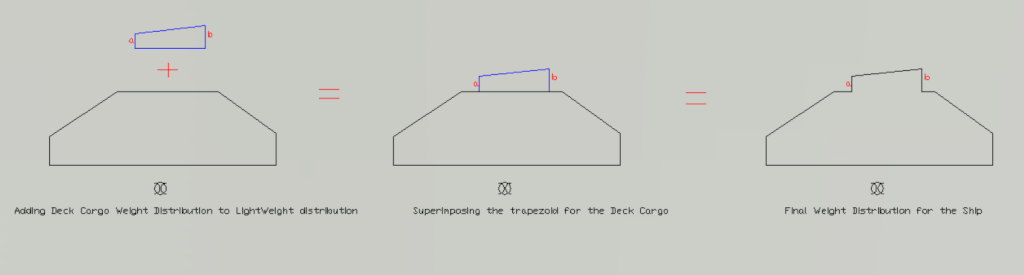
Once the distributions of all items of deadweight have been added to the Lightweight curve, then we will arrive at the final Weight Distribution Curve. It may look something like this:
Buoyancy Distribution Curve
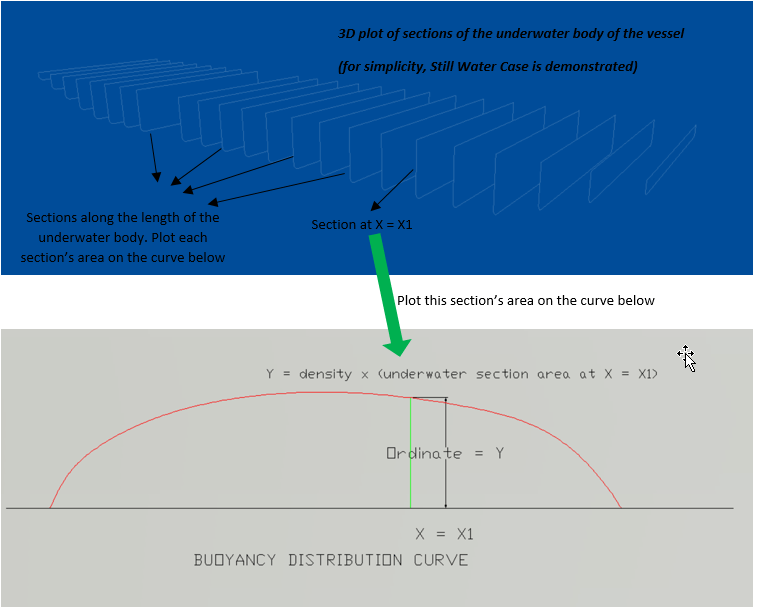
Once we have the Weight distribution, the next step is to create the buoyancy distribution curve. The basic idea is same – to plot the load due to buoyancy at each point along the length of the ship.
The buoyancy force is determined by the shape of the underwater hull, and it is the weight of the water displaced by the underwater hull. With this understanding, we can see that the buoyancy distribution is same as the volume distribution of the underwater portion of the hull. If the underwater volume is divided into sections of unit length along its length, then the volume of the underwater hull is nothing but an integration (or sum) of the areas of these sections along the ship’s length. Thus, the buoyancy distribution is a plot of the section areas of sections along the length of the underwater body of the hull.
Still Water condition vs Wave conditions
Here it is useful to take note of the wave condition in which the ship is sailing. The underwater body of the ship is variable, as it keeps encountering waves of different sizes. However, when there are no waves present, then the water can be considered still, and the waterline is horizontal. This floating condition of the ship is called Still Water condition.
How do we take care of the waves? They are of different sizes. For design purpose, we consider that the vessel should be able to take a wave whose wavelength is equal to the length of the vessel itself. There can be two cases for such a wave – one case when the crest of the wave is at midship (and troughs are at ends of the ship), and the other when the trough is at midship (and crests at ends of the ship). The Still Water case and the two wave cases are depicted below. We can see that the effect of the wave cases is to increase the hogging or sagging of the vessel.
Whatever the underwater profile of the vessel (whether still water or wave cases), we need to plot the buoyancy distribution curve accordingly.
Steps for plotting the Buoyancy Distribution Curve
The buoyancy curve in the plot of section areas of the different sections along the length of the vessel. Usually the sections are taken at the stations of the lines plan of the vessel. The body plan is used to get the section areas of the stations. This process is shown below:
Plotting the final Load Distribution
Once we have the Weight and Buoyancy distributions with us, we superimpose them, and at each point of the weight curve, we deduct the corresponding buoyancy value to obtain the point on the load curve. This process is demonstrated below:
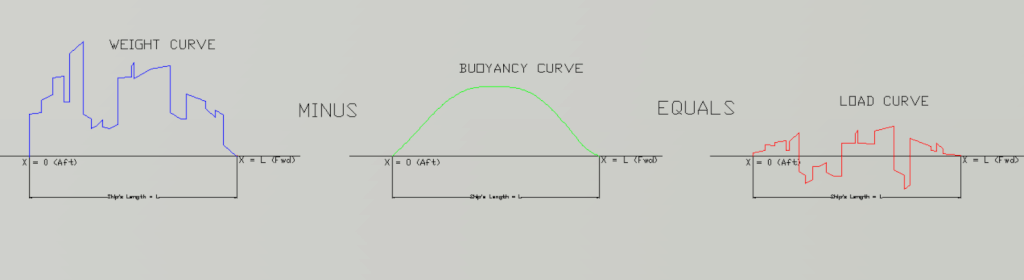
We can see that the load curve has both positive and negative ordinates. Put simply, the weight is higher than buoyancy at some places which buoyancy is higher at other places. When the ship is in equilibrium, the total Weight and total Buoyancy are equal. Thus, the positive and negative areas of the load curve cancel out and the net area of the load curve is zero for vessels in equilibrium.
Integration of the Load Curve to get Shear Force Curve
Now that we have the load curve, we need to integrate it to get the Shear Force Curve. What is this integration, and how is it carried out?
The Shear Force at any point along the length can be found out by adding the area under the load curve up to that point. For example, if we want to find out the Shear Force on the vessel at a location x = L/4 along its length (where L is the total length of the vessel), then we need to add-up the area under the load curve from x = 0 (aft end) to x = L/4. This process is called the integration of load curve to obtain Shear Force, and is shown below.
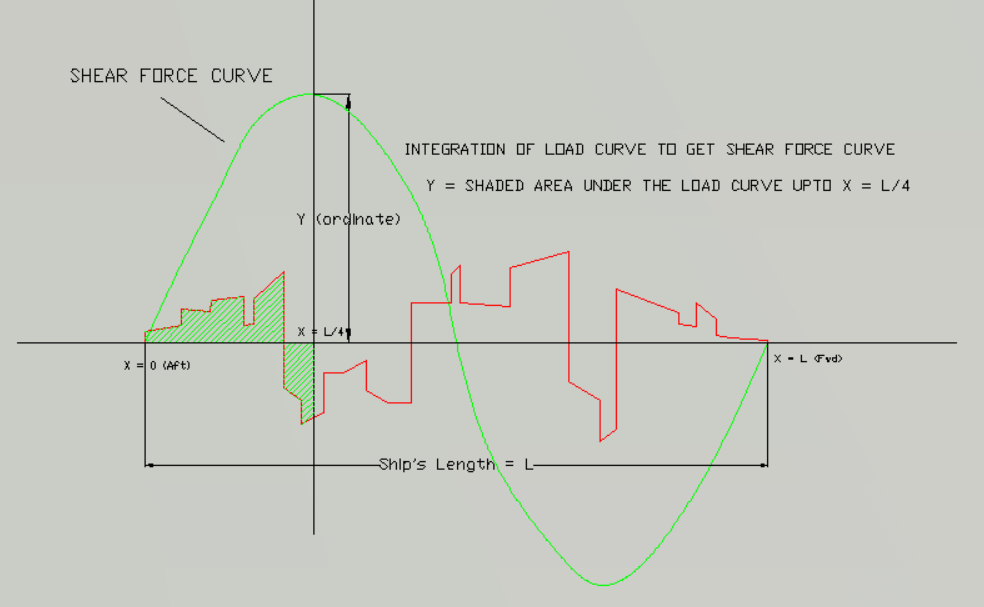
The above process of finding the shear force is done at different locations (usually the stations) along the length of the vessel. This gives us the Shear Force values at these locations. If we plot all these Shear force values along the length of the vessel, then we obtain the Shear Force Curve, which looks like the green curve in the above picture
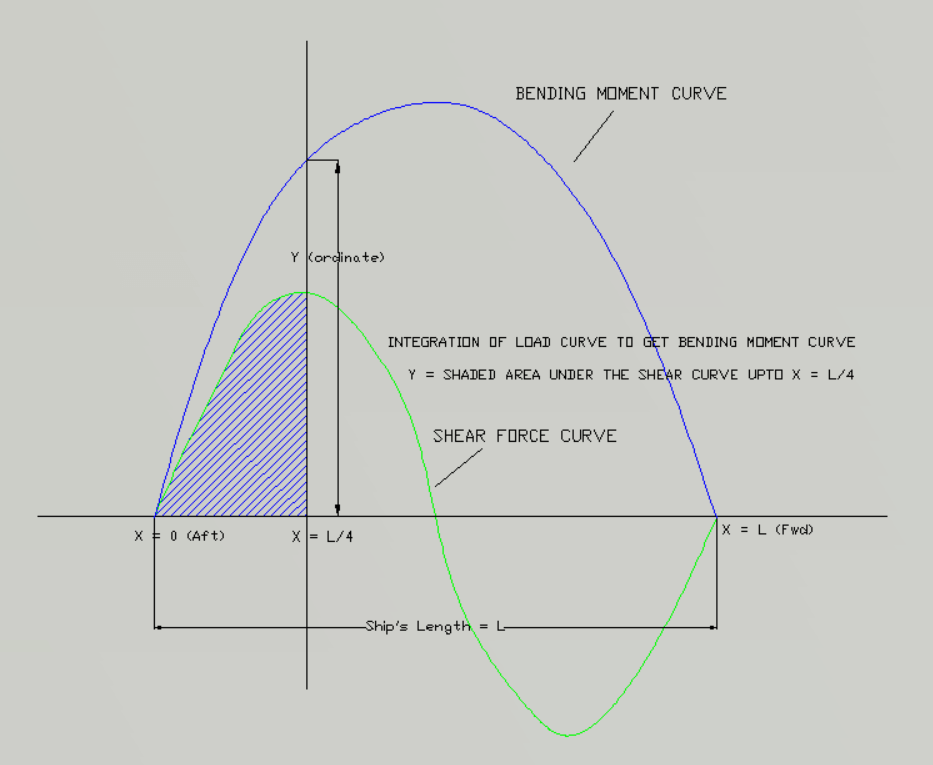
Integration of the Shear Force Curve to get Bending Moment Curve
In a similar fashion as done with the load curve, we use the Shear Force curve to obtain the ordinates of the Bending Moment at different locations along the ship’s length, and plot these points to obtain the Bending Moment Curve of the ship. It looks something like this:
Comparing the results against allowable values
So now we have the Shear Force and Bending Moment distributions along the length of the ship. What next? We need to check if these are within the allowable limits of the vessel. How do I find out the allowable limits?
The allowable limits of Shear Force and Bending Moment are the values which the structure of the ship can take. Like in the case of a beam where the beam’s cross sectional properties determine the limit of the forces and bending moments it can take, the Ship’s capacity to take shear and bending depends on its sectional properties. By ‘section’ here we mean the structural section of the ship, which looks something like this:
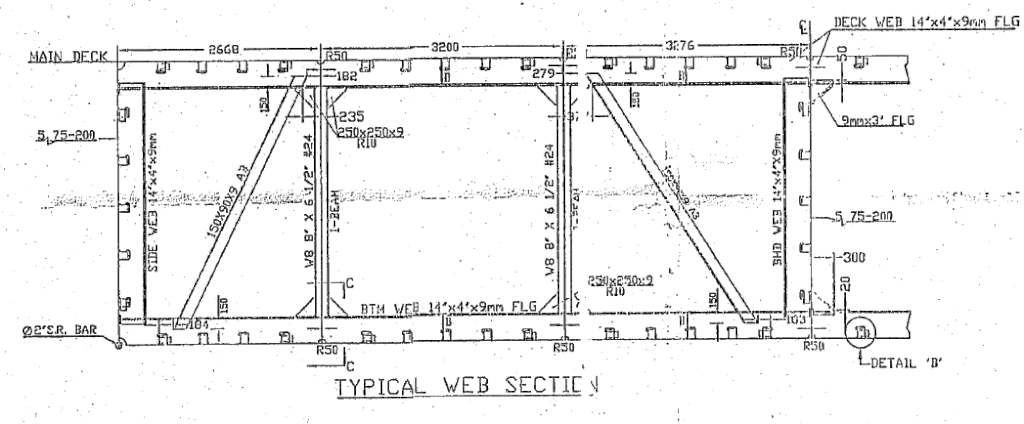
Since the ship’s section shape keeps varying along its length (though it is same for the parallel mid body), the section properties are also different at different locations along the length of the ship. Thus, the capacity of the ship to take shear and bending is also different at different longitudinal locations. The limits at a particular location along the ship’s length are calculated from the following relations
SFallowx = τallow x AX
BMallow = σallow x SMX
Where
SFallowx is the Shear Force allowed at a particular location X along the length of the ship
τallow is the allowable shear stress of the ship’s material
AX is the Area of the structural section of the ship at location X.
BMallow is the allowed Bending Moment at a particular location X along the length of the ship
σallow is the allowable bending stress of the ship’s material
SMX is the Section Modulus of the structural section of the ship at location X.
The values of τallow and σallow can be obtained from Class Rules. For example, ABS rules require σallow to be 17.5 kN/cm2 (or 175 MPa) and τallow to be 11.0 kN/cm2 (or 110 MPa) for ordinary steel (See Ref 1, Part 3-2-1/9.3). For higher strength Steel, these may be reduced by factors provided in Class Rules.
Section Area and Section Modulus
Section Area and Section Modulus are the properties of the structural section of a ship at the chosen location along its length, which is the actual cross section of the ship showing all structural elements like plates, stiffeners, girders, brackets etc. See the figure above.
The calculation of section properties (Area, Inertia and Section modulus) is a separate study and will not be dealt with in detail here. To know more about calculating the Area and Section Modulus of a structural section of a vessel, do check out our app Midship Section Modulus Calculator
The section properties need to be calculated for different locations along the length of the vessel. For each of these locations, the allowable bending moment and shear force need to be calculated. Once we have the allowable values at different points along the length of the ship, we compare them to the actual obtained values of SF and BM at these points. If the SF or BM is exceeding the allowed values at even a single point along the length of the ship, then the ship’s structure is NOT adequate in the proposed loading condition.
Practical importance and implications of Longitudinal Strength Calculations
During design stage
Longitudinal strength calculation forms an integral part of the stability booklet of the vessel. All the loading conditions (e.g., fully loaded departure/arrival or ballast departure/arrival) in the stability booklet should have an accompanying longitudinal strength calculation. This establishes the suitability of the vessel from a strength point of view in all common loading conditions expected.
During actual vessel operation
Longitudinal strength becomes all the more critical during actual vessel operations. For vessels with a loading computer, each loading condition should be evaluated in the loading computer for longitudinal strength before commencing loading. For vessels without a loading computer, like dumb barges, the longitudinal strength must be evaluated in a standard software (like GHS/Sutohydro/NAPA etc.) before loading is commenced. For smaller ships, longitudinal strength calculations are not mandatory and may be exempted.
What to do if the Longitudinal Strength is not adequate for a loading condition?
If the longitudinal strength is not within allowable limits, following are some useful tips
- If the vessel is in design stage, then structural modifications may be done to improve the Section modulus (e.g., by enlarging a girder, or increasing plate thickness etc.) and thus improve the allowable Bending Moment/Shear Force.
- If the vessel is in operation and software calculations demonstrate a failure of longitudinal strength, loading should not be commenced.
- First, check the location at which the bending moment is exceeding the allowable limit. Usually the location of failure is near midship, since the moment is highest around midship region.
- If the failure is in sagging, then there is high load around midship region. This can be corrected by shifting ballast from midship region to aft/fwd ends (subject to availability). If the failure is in hogging, then there is high load at the ends. This can be corrected by shifting ballast from ends to midship region. At times, relocation or rearrangement of deck cargo also helps in reducing the bending moment.
- The distribution of cargo is also critical in determining longitudinal strength. If the vessel has, say, seven holds, and if four holds are to be filled with cargo (and rest empty), then there are many ways of doing it. Each method will have a different effect on longitudinal strength
- We can fill the 2nd, 3rd, 4th and 5th The loading will be more in the midship region and lead to higher sagging
- We can fill the 1st, 2nd, 6th and 7th This will lead to higher loads at ends, and thus higher hogging
- Fill the 1st, 3rd, 5th and 7th This way, the load is evenly distributed along the length of vessel, neither leading to too much sag or hog.
- Thus, different approaches may be applied to deal with a situation in which longitudinal strength limit is exceeded.
Conclusion
That brings us to the end of this discussion. Longitudinal strength of ships is a critical factor which affects both the design and operation of the ship. Careful planning and supporting calculations during the design stage should be carried out to ascertain the vessel’s suitability from strength point of view. During actual operations, loading conditions should be created keeping in mind the allowable limits and longitudinal strength capacity of the vessel.
We hope this post was of use to you. Do let us know your thoughts in the comments section
References
- ABS Rules for Classification of Steel Ships, Part 3
- http://www.mathalino.com/reviewer/mechanics-and-strength-of-materials/relation-between-load-shear-and-moment
- https://www.sawe.org/files/Methods%20of%20Longitudinal%20Weight%20Distribution.pdf
Disclaimer: This post is not meant to be an authoritative writing on the topic presented. thenavalarch bears no responsibility for the accuracy of this article, or for any incidents/losses arising due to the use of the information in this article in any operation. It is recommended to seek professional advice before executing any activity which draws on information mentioned in this post. All the figures, drawings and pictures are property of thenavalarch except where indicated, and may not be copied or distributed without permission.

Good explanation of SF & BM.
Enjoyed reading it.
Are there any Regulations regarding SF & BM Limits on a, say, 10 years old ship ?
Thanks & Regards
Capt.R.K.Sood
Faculty
FOSMA, NOIDA & AEMTC New Delhi.
Dear Captain
You can find the regulations of Class Societies. Say, for Barges, you can use ABS Rules for Barges, ABS Steel Barge Rules 2019, Part 3, Hull Construction and Equipment, Ch 2, Section 1
Very nice way of explaining and all points discussed.
Thanks and with warm regards,
L S Ganapathy, Chief Engineer Steam & Motor
HIMT, Chennai
Very well explained ….thanks
Prem your presentation is so wonderful…please connect. SF BM is perhaps the most overlooked risk the seafaring community needs help with… 7838748668 appreciate whatsapp connect
INTERESANTEARTICULO SOBRE ESFUERZO CORTANTE YOMENTO FECTOR VIGA BUQUE
Apt approach.