Mooring System Design and Analysis
by Rahul Kanotra, Consultant Naval Architect

As the offshore industry moves towards greater technological advancements, one thing that has plagued the engineers is the “plug and play” computer programs or software. I am not against any software as such, and in fact, I am a big fan and power user of Bentley’s MOSES program. What I do not like is engineers blindly feeding inputs in the software to get outputs without actually understanding the theory behind engineering problem at hand. Engineers these days spend more time on mastering the software manual then the actual theory itself. I have been extremely fortunate to be mentored by some of the best Engineers/Managers/Professors in both industry and academia. As a passionate Naval Architect, I have always had a deep interest in the interaction of floating/fixed bodies with sea waves. In an attempt to share my knowledge of offshore installation engineering, I am going to write a series of articles on various offshore engineering analysis. The target audience is fellow Naval Architects, Engineers, Project Managers and anyone interested in learning about the field. As these articles will be targeted for the audience from diverse backgrounds, I will try to keep things as simple as possible. I will use Bentley’s MOSES as the prime software and get into the details of inputs and outputs. I recently delivered a training session to a group of structural engineers on the topic “Mooring Analysis and Design,” and I have chosen the same topic for my first article.
Mooring System Fundamentals
A mooring system comprises a floating body (or collection of bodies) which are connected to the sea floor (or terminals) by a system of lines that provide restoring forces against external loads. The General purpose of mooring lines is:
- To keep the body in reasonable proximity of some target location (Station Keeping).
- To operate in deep water (Drilling Rigs, FPSOs, TLPs, ).
- To allow re-location of the units such as pipe laying barges.
- To check clearance with other units or pipelines during drilling campaigns or installation procedures.
- Loading/Unloading operations.
Mooring System Classification
Mooring systems are broadly classified into two categories namely slack (or catenary) mooring system and taut mooring system as shown in Figure 1.
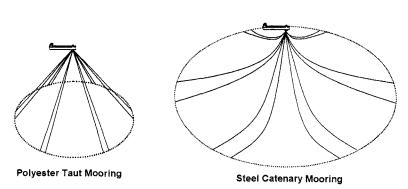
Figure 1: Taut Mooring vs. Catenary Mooring (Source: Chakrabarti, S. K. (2005). Handbook of offshore engineering. Amsterdam: Elsevier.) It is important to understand the fundamental differences between the two as the restoring forces generated in both are due to different mechanisms. In slack (catenary) mooring lines the restoring forces are mainly due to the result of a change in suspended weight of lines whereas in taut mooring the restoring forces are generated primarily due to the result of the elasticity of the line. Below figures demonstrates the difference between taut mooring and catenary mooring.
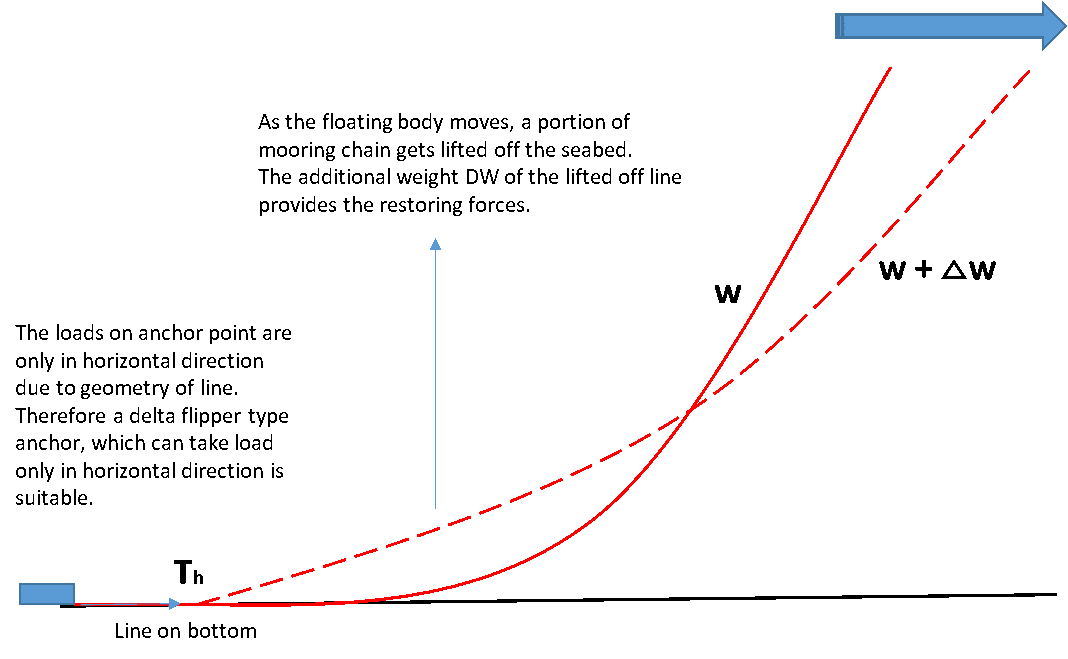
Figure 2: Restoring forces – Catenary Mooring
Figure 3: Restoring forces – Taut Mooring
Ever wondered why slack mooring is also called as catenary mooring? It is easy to mathematically prove that any line/chain suspended under its self weight assumes a shape of a geometric curve called catenary. The geometry of the offshore slack mooring line is the same as a chain suspended between two poles. The only difference is that one end of the offshore mooring line is connected to the anchor and another end to the fairlead of the floating body. Also, the offshore mooring line has buoyancy and hydrodynamic forces acting on it unlike in case of a chain suspended in air between two poles. I have pointed out this similarity between offshore mooring line and a chain suspended between two poles to illustrate the simplicity of the problem at hand. The physics behind mooring line behavior is not different from that of a suspended chain in the air. In the below figure let’s assume that the length of the chain is S and weight per unit length is W. The Tension on each side of the pole is same as T (due to symmetry) and the angle it makes with horizontal is Փ. Now balancing forces in vertical direction gives us : 2 T Sin Փ = WS T = WS/2 Sin Փ

Figure 4: Chain suspended between two poles – Catenary
Mooring System Design and Analysis
Now that we understand the basic difference between taut mooring and catenary mooring lines let’s look at the design and analysis aspects of a mooring system. Let’s assume a simple scenario of a barge moored by 8 point catenary mooring system. To analyze this system in any software, we need to input the properties of each mooring line and barge system. One of the best software’s out there is Bentley’s MOSES software. I like working in MOSES due to its inbuilt coding language environment which makes it possible to look at different scenarios and be creative with the problem at hand. Below are the inputs provided in MOSES software.
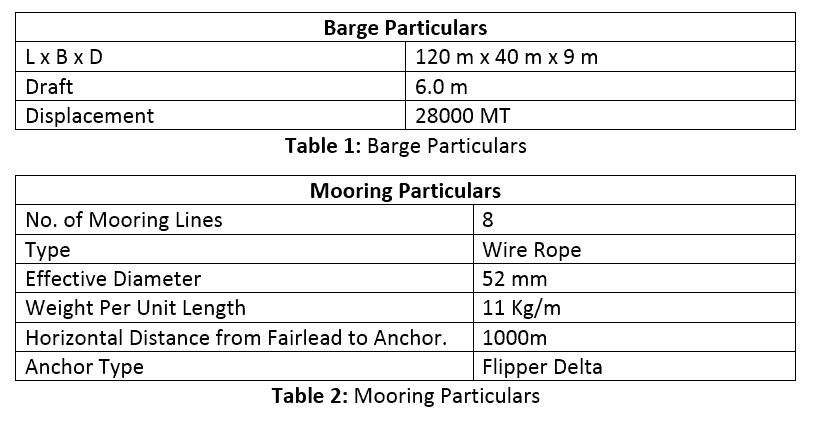
The mooring pattern of the barge is symmetric about X and Y axis as shown in the Figure 5. The horizontal distance between fairlead and anchor point is considered to be 1000m for each line. It should be noted that the mooring pattern will not always be as pretty in the real world. There may be subsea assets (pipelines, manifolds, etc.) in the vicinity and therefore the length and orientation of each line may differ. Engineers must strive to keep the mooring pattern as symmetrical as possible for better load distribution.
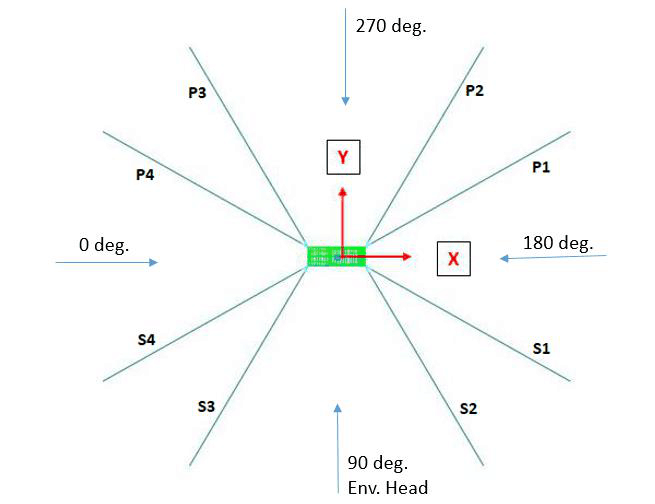
Figure 5: Top View – 8 Point Mooring Spread.
Figure 6: Isometric View – 8 Point Mooring Spread.
Now before analyzing this mooring system let us look at the things which we have some control over, during the actual field operation. The anchor drop location and therefore the length of each mooring line can be changed. The individual mooring lines can be tended based on the direction of environmental forces. The mooring tension in the line can be increased/ decreased by paying out/in line from the winch. Below Figure 7 illustrates the effect of line tension on the catenary profile of any one mooring line. As the tension is increased (line length reduced) more length of the line is lifted off the seabed. For slack condition, the whole length of the line is laying on the seabed whereas for 200 MT tension the entire line is off the seabed. The Delta Flipper type anchor can only take loads in the horizontal direction, and therefore it will not hold ground for 200 MT line tension. From this exercise, we get a good idea of tension limitations on each line from anchor uplift point of view. It is to be noted that line tension/ geometry of line will also change with the change in horizontal distance between anchor and fairlead.
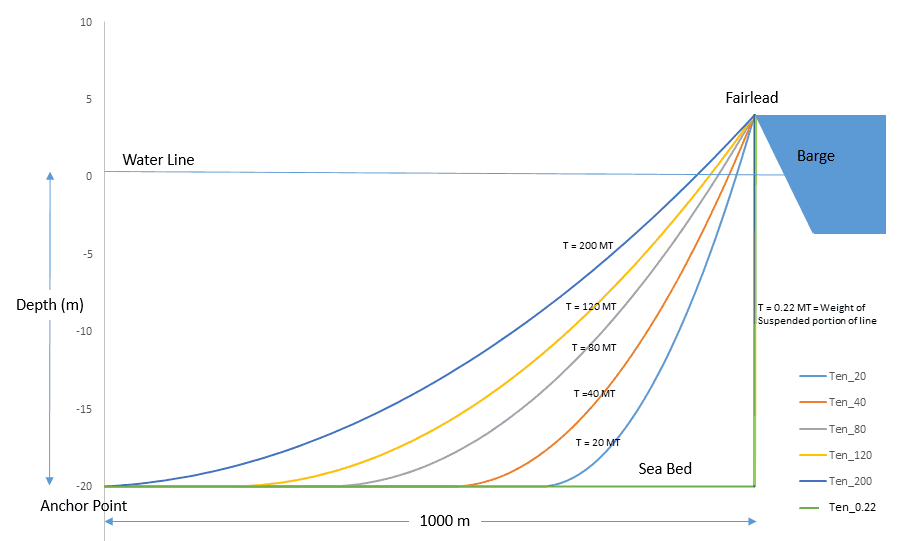
Figure 7: Catenary Profile for varying Tensions
Now that we have looked at the characteristics of the individual lines, the next step is to study the characteristics of the whole barge mooring system. From a mathematical point of view, it is useful to see the restoring force due to mooring vs. the barge excursion. Figure 8 plots the mooring system restoring force due to barge excursion in the X direction (Refer to Figure 5) for different pre-tension. As we know that the pre-tensions in each mooring line can be increased or decreased by the deck crew by operating the winches. It can be seen that higher the pre-tension the stiffer the system, i.e., lesser excursion for the same amount of force. However, the higher stiffness also means higher line forces and risk of breaking of highest loaded lines. Therefore, we need to keep a balance between barge stiffness vs. excursion to ensure safe mooring design.
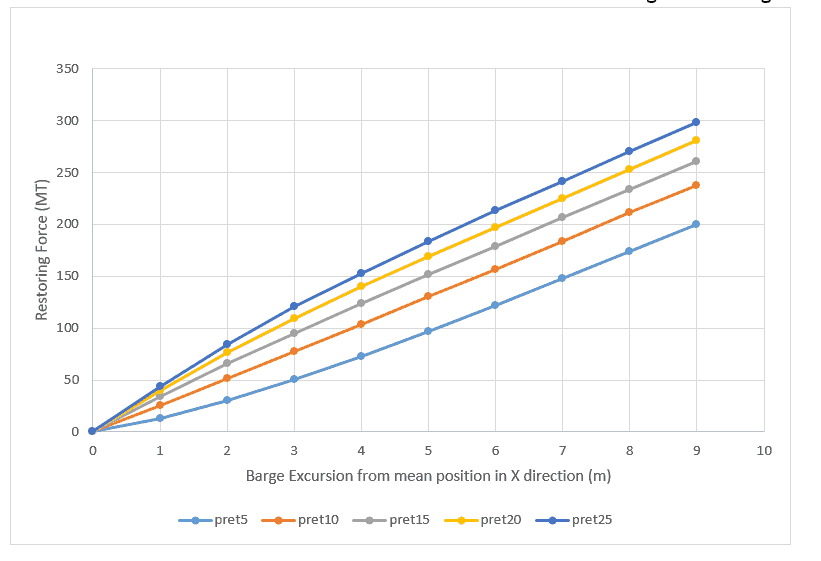
Figure 8: Barge excursion (from the mean) vs. Restoring Force in Mooring
Up until now, we have talked about the characteristics of internal forces generated by the mooring system, i.e., the restoration forces. In the following section, we will discuss the external excitation forces on the barge mooring system. Any floating body in the sea is subject to some, or possibly all of the following loads:
- Winds
- Current
- Waves/ Swell
- Tides
For all practical purposes the environmental forces due to winds, current and mean wave forces can be considered as static and are easy to deal with using static analysis. The total forces due to static components are calculated and equated to the restoring force to calculate total barge excursion from mean position. One thing which is very crucial for Engineers is to have a “feel” of the magnitude of environmental force for a given size of the barge and operational sea states. A great resource that every Engineer should refer to when analyzing a mooring system is OCIMF – Mooring Equipment Guidelines 3rd Edition. Appendix A of this document provides detailed calculations for calculating environmental forces due to wind and currents. Now that we have talked about static forces the next step is to look at the dynamic forces due to waves and swells. In a typical mooring analysis in MOSES, the hydrodynamic model of the vessel is created to perform the analysis to identify the optimum mooring configuration. The software considers steady state loading from current, wind and wave drift and oscillatory loading from direct waves and low frequency components of wave/wind drift. The required hydrodynamic database is generated using the ‘three diffraction theory. The analysis is performed in the time domain. The expected peak values of the barge motion, excursion and line tensions are derived from a computer simulation time of 1200-1800 seconds using input sea spectra (such as JONSWAP, ISSC, etc.). The analysis is usually performed for eight headings (head, stern, beam, quartering seas) as shown in Figure 5. In order to calculate maximum excursions and forces the loads due to wind, wave and currents are applied collinearly for each heading. The mooring analysis is performed for Intact and Damaged condition as shown in Table 3.
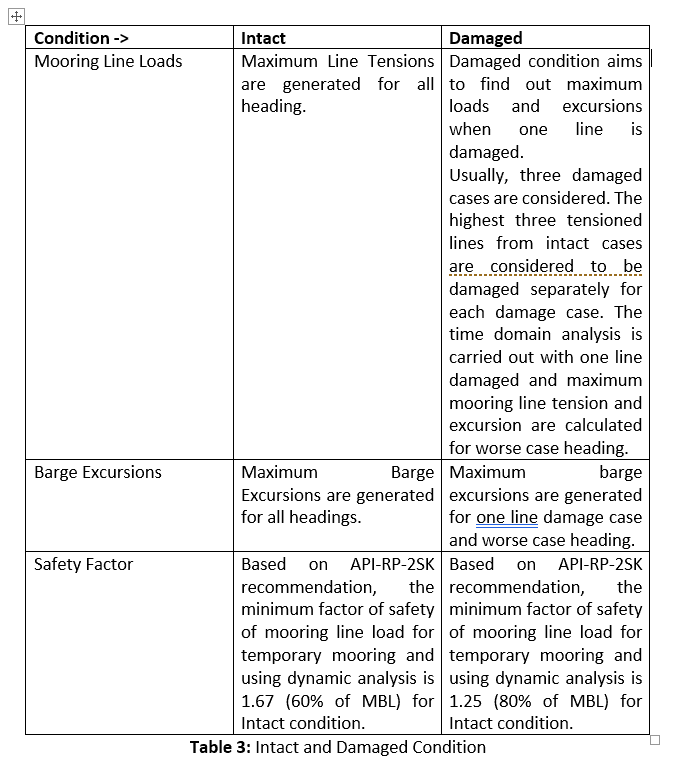
Table 3: Intact and Damaged Condition
The predicted maximum mooring tensions and excursion results of mooring analysis in MOSES are summarized in Table 4 and Table 5 respectively. It is no surprise that maximum tension occurs for beam seas where the largest underwater and above water surface area is exposed to winds, waves, and current.
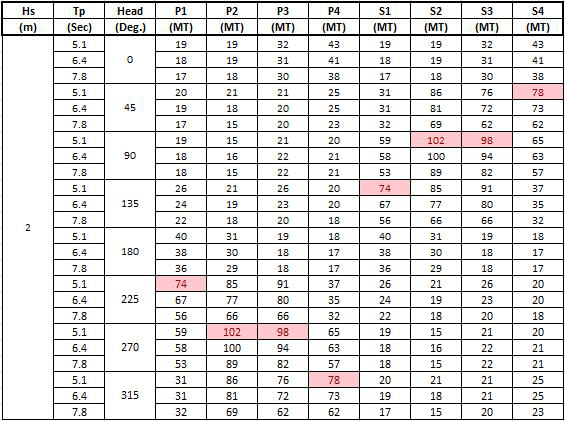
Table 4: Mooring Line Loads – Intact Condition
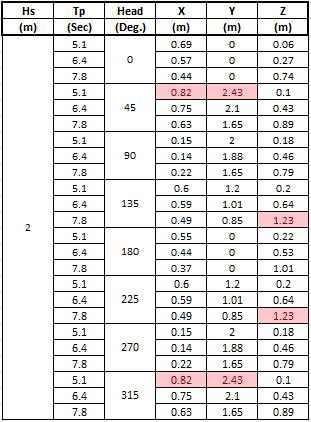
Table 5: Barge Excursions – Intact Condition
Figure 9 shows the mooring line tensions for the environment in which the highest tension occurs in line S2. Figure 10 shows the barge excursion in the Y direction for the same case.
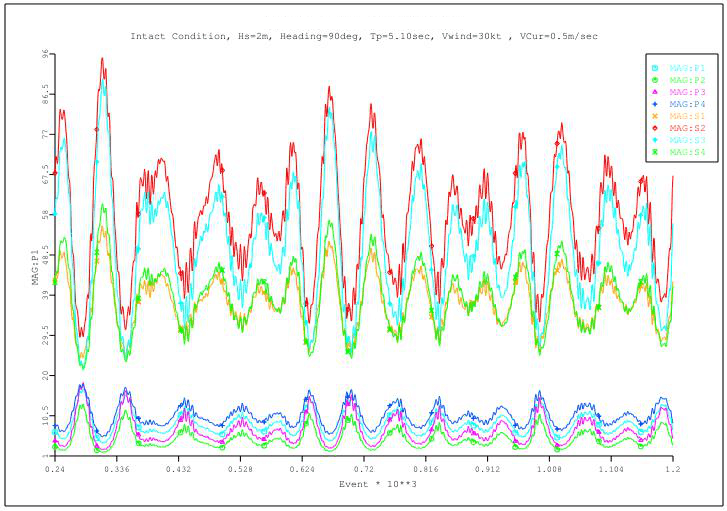
Figure 9: Mooring Line Tensions – Intact Condition
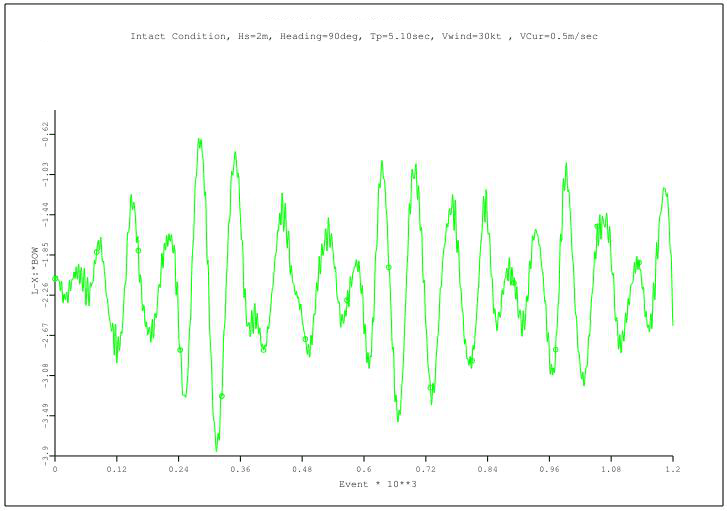
Figure 10: Barge excursion (from the mean) in Y direction –Intact Condtion
Once the intact case is analyzed, the next step is to study the mooring system for one line damaged condition. In damaged case, the time domain simulation is run for top three load cases that generated the highest line tension in the intact condition. Remember damaged condition aims to find out maximum tension and excursion that would occur if any one line is damaged. In our example, the damaged case is analyzed for Hs = 2m, Tp = 5.1 seconds, Heading 90 deg., and line S2 is considered damaged. The maximum line tensions from MOSES time domain simulation in the damaged case are plotted below in Figure 11. It can be seen that line S1 that is adjacent to S2 takes the maximum load when S2 is damaged.
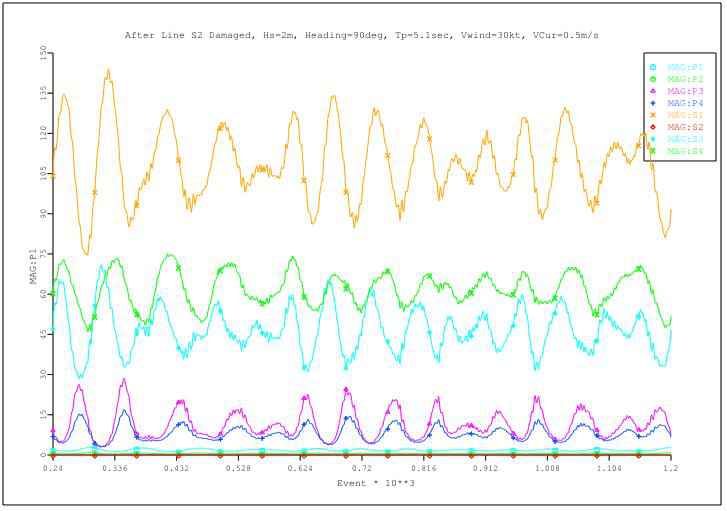
Figure 11: Barge excursion (from the mean) vs. Restoring Force in Mooring
The maximum loads and excursions obtained from analysis should be within maximum allowable limits as per guidelines such as APIRP-2SK. The maximum loads should not exceed the “weakest link” of the Mooring system. I would like to conclude by emphasizing that Mooring analysis and design is an iterative process dependent on environmental as well as operational constraints. Engineers should exercise due diligence while analyzing any mooring pattern for the safety of crew and offshore assets. Feel free to share this article and post comments if any. Until next time, have a great day.

Rahul Kanotra, C.Eng.
Consultant Naval Architect, Installation Engineering Expert
-
Capstan Design (Required power for Berthing)
$49.00 Add To Cart -
Sale!
Equipment Number Calculator for Yachts(BV Rules)
Original price was: $149.00.$0.50Current price is: $0.50. Add To Cart -
Equipment Numeral as per IACS
$99.00 Add To Cart -
Fishing Vessel Equipment Number Calculator
$39.00 Add To Cart -
Mooring Forces Calculator (Port or Stbd on Quay)
$99.00 Add To Cart -
Mooring Forces Calculator (Stern on Quay, 4-Point Mooring)
$99.00 Add To Cart -
Mooring Line Catenary App
$99.00 Add To Cart -

Mooring Line Catenary with Buoy
$99.00 Add To Cart -
Motion Response Calculator
$99.00 Add To Cart -
OCIMF Anchoring Environment Loads Calculator
$99.00 Add To Cart -
Sale!

OCIMF Berth Mooring Design Calculator
Original price was: $299.00.$249.00Current price is: $249.00. Add To Cart -

OCIMF Environment Forces Calculator – Gas Carrier (updated to MEG4)
$99.00 Add To Cart -

OCIMF Environment Forces Calculator – Tankers (Updated toMEG-4)
$99.00 Add To Cart -
Ship Design MBL Calculator – IACS
$99.00 Add To Cart