Introduction
Towlines connect a tug to the vessel being towed and are defined by multiple characteristics like Weight, Diameter, and Stiffness. The tension in the towline during the towing operation is not static but keeps varying with the distance between the tug and the vessel being towed. It is quite obvious that when the distance between the vessels is high, the tension shall be higher, and vice versa.
When the tug and the vessel are closer, the towline becomes slack and a sag in the towline is expected. The sag is also caused due to the self-weight of the towline, thus leading to the formation of a ‘catenary with a sag’ in the towline, instead of a straight line.
Towlines have a significant weight of their own, and due to their self-weight, the towline may not be in the shape of a straight line when in use. Despite the tension in the towline that makes the towline straight, the self-weight of the towline makes it sag. This sagging is not a desirable feature if the water depth available is low, as the towline may touch the seabed which will lead to its wear.
In this article we’ll explore a theoretical method to calculate the catenary and sag of a towline. It is to be noted that this method is highly simplified in approach, and assumes the towline as a single rope with uniform weight and cross section. However, in reality, the end of the towline which connects with the towed vessel carries the towing bridle which makes that end heavier and makes the catenary asymmetric. The complication arising out of the towing bridle is not covered in the current article, and will be a subject of future articles.
The sag of a Towline
Since the tension in the towline is a dynamically changing parameter, so the sag of the towline also keeps changing during the course of towing. A sudden or temporary increase in the sag of the towline may lead to sudden sag in the towline which may lead to fouling of the towline or dragging on the seabed. This is an undesirable situation, and so it is important to be able to calculate the sag in the towline by knowing the parameter of the tow.
Basically, the sag will depend upon the following parameters:
- The tension in the towline
- The length of the towline
- The self-weight of the towline
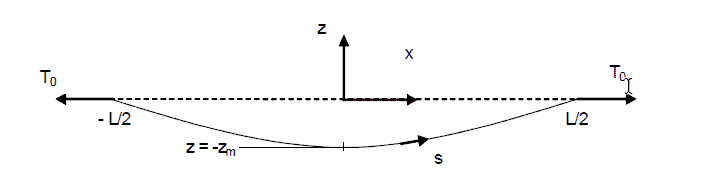
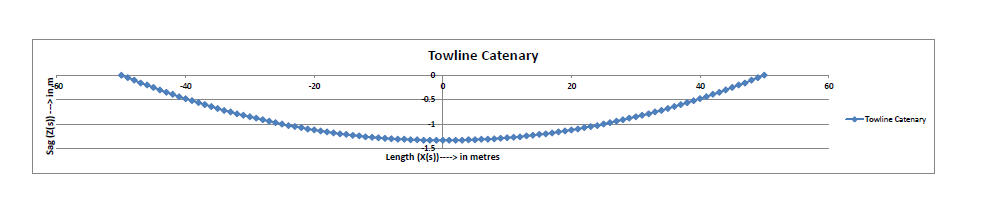
The figure above can be used to represent the catenary of a towline. We can see the following important parameters form the above figure:
- The tension in the towline is T0. This is a variable parameter and is dynamically changing throughout the towing operation. A higher tension in the towline will lower the sag
- L – is the length of the towline. The towline length should be sufficient to maintain a safe distance between the tug and the vessel towed. As the distance between the two vessels changes, so does the sag. A smaller distance between the two vessels will lead to greater sag.
- Z – this is the sag in the towline at any point along its length. Zm is the maximum sag which is experienced at the mid-towline-length
- s – this is the coordinate measured along the length of the towline (and not along the X-axis). It is to be noted that s will vary from -L/2 to +L/2 along the length of the towline
Defining a Catenary
As we can see in the figure above, the catenary is characterized by two coordinates:
- X-coordinate – runs along the horizontal axis, and measures the distance between the tug and the towed vessel. X is measured not along the catenary’s length, but along the horizontal
- Z-coordinate – runs along the vertical axis, and measures the depth of the catenary at any location X
While the value of ‘s’, the coordinate along the towline, varies from -L/2 to +L/2, the range of the values of ‘x’ will depend upon the tension in the towline, T0. At higher tensions, the catenary is flatter and the range of ‘x’ will be higher. At lower tensions, the catenary is deeper and the range of ‘x’ is lower. In the ideal case, when T0 is infinite, the range of ‘x’ becomes equal to L (length of the towline).
The catenary will be plotted with a range of x(s) and z(s) values, with each coordinate being a function of the catenary length ‘s’. DNV-RP-H-103 provides the formulations for each coordinate in Sec 7.2.3. These are presented below. These are applicable when the tension of the cable is much larger than the weight of the cable (and gives good estimates even when they are comparable).

From the above formula, we can see that it depends on the following additional parameters:
- w – submerged weight per unit length of the towline. Here, we emphasize the word ‘submerged’. This is the weight in water while factoring for the buoyancy which the towline will experience inside water. To calculate ‘w’, we use a simple formulation:
w = weight of towline in air – buoyancy of towline inside water
The weight of the towline in air is obtained from the towline’s specifications. If the mass per unit length is ‘m’, then the weight per unit length is (m x g), where ‘g’ is the acceleration due to gravity.
To get the buoyancy of the towline inside water, we follow the fundamental principle of calculating buoyancy: Buoyancy = volume of submerged body x density of water
How do we calculate the submerged volume of the towline? Since it is cylindrical in shape, the formula for volume is
Volume = Section area x Length
The volume per unit length will equal to the section area of the towline.
Let’s take a look at the typical section of a towline. It is shown below. We can see that the section area is not fully circular, as it is made of individual strands of ropes put together. Thus, no the entire area of the circumscribing circle is filled up with steel ropes. The percentage of the area of the circumscribed circle which is actually filled with steel ropes is called the ‘Fill Factor’. The fill factor CF can be obtained from the towline manufacturer, or by looking into the towing rope specifications
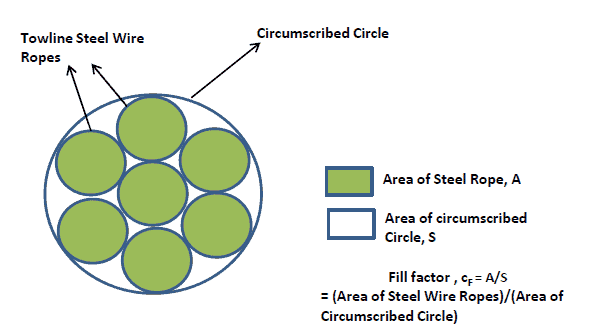
The net area of the steel rope can be found out as
A = CF x S
Where CF is the fill factor, and S is the total circumscribed area. ‘A’ is also the submerged volume per unit length of the towline.
Thus, the buoyancy of the submerged towline is given by
Buoyancy = ρw x A x g = ρw x CF x S x g
The submerged weight per unit length is given by
w = (m – ρw x CF x S) x g
- EA – The term ‘EA’ is the Modulus of Elasticity of the towline multiplied by the nominal sectional area of towline (A).
Modulus of elasticity can be measured in units Pa, MPa, or GPa. The modulus of elasticity of a steel wire towline is typically 40% of that of solid steel. The Modulus of Elasticity of solid steel is 206000 MPa, and the value for steel towline generally comes to 80000 MPa.
Plotting the Catenary Curve
Once we have all the inputs with us, we can use the catenary equations provided above to plot the catenary of the towline at any given tension T0.
This requires calculating x(s) and z(s) at different values of s. The value of ‘s’ ranges from 0 to L (L = length of towline), and we can tabulate the values of s, x(s), and z(s) at fixed intervals of s. It may look like below:
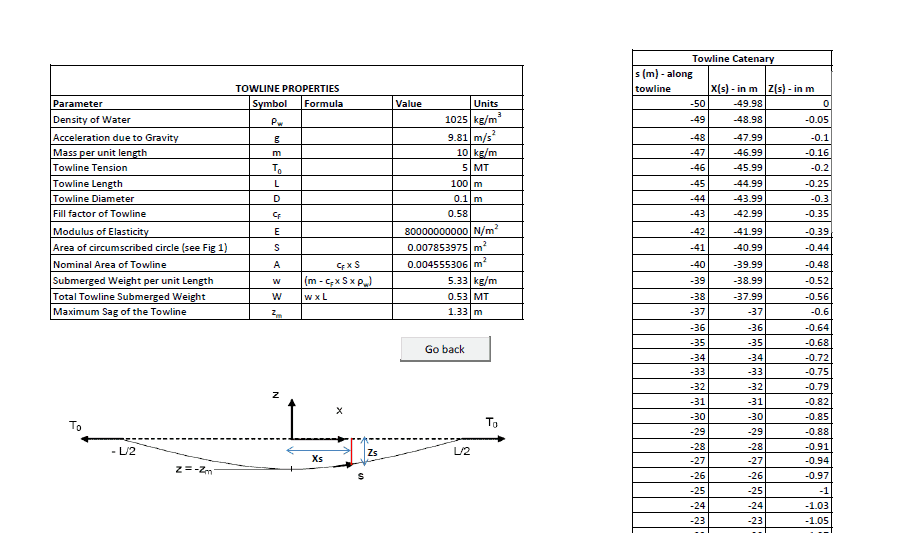
We can see from above that the catenary properties are listed in the table on the left, while catenary coordinates are listed in the table on right.
The catenary can also be plotted in Excel using the coordinates above, and may look like below:
Maximum Sag
The most interesting data from the catenary curve above is the maximum sag in the catenary, which is at the mid-catenary. The maximum sag is the most critical parameter to know for safe towing operation. Situations of towline dragging on the sea bed will lead to fouling of the towline and can be avoided by knowing the maximum sag.
It is quite obvious that the sag in the towline will vary depending on the towline tension. The higher the tension, the lower is the sag, and vice versa. The formula for maximum sag in the towline is given by below:
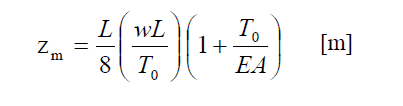
Since all parameters except T0 are fixed, we can vary T0 to see how it affects the maximum sag. The minimum tension is for the case when the towline is just hanging under its own weight, and the maximum tension shall be when the towline tension is equal to the maximum bollard pull of the tug. By varying T0 between these two values, we can calculate zm using the formula above, and put it in a tabular form (see below). A graph can also be plotted to demonstrate how the maximum sag varies with the towline tension
That brings us to the end of this article. We have seen how the catenary of a towline can be computed, and also how the maximum sag can be computed. These calculations are useful in knowing the towline clearance from the seabed, and also to ensure a safe tow.
References
- US Navy Towing Manual
- DNV RH-H-103, 2011
https://www.thenavalarch.com/towline-catenary-calculator/
Disclaimer: This post is not meant to be authoritative writing on the topic presented. thenavalarch bears no responsibility for the accuracy of this article, or for any incidents/losses arising due to the use of the information in this article in any operation. It is recommended to seek professional advice before executing any activity which draws on information mentioned in this post. All the figures, drawings, and pictures are property of thenavalarch except where indicated, and may not be copied or distributed without permission.
Webcast: Rapid Rigging
Learn a rapid and practical method for generating accurate rigging arrangements and estimating rigging loads in one hour or less using simple engineering principles and streamlined workflows. TECHNICAL WEBCAST OVERVIEWLifting operations can be executed far more...

TheNavalArch’s Interview Series: Peter Farthing (MD, Sensor Technologies)
Peter FarthingManaging Director of Sensor Technologies Ltd and CEO of Advantec Group Limited Interview Introduction TheNavalArch's Interview Series is an endeavor to get insights from the best engineering and business brains in the industry and present them to its...
TheNavalArch Interview Series: Capt Robin Perera
TheNavalArch's Interview Series is an endeavor to get insights from the best engineering and business brains in the industry and present them to its users for the larger benefit of the maritime community. Leaders share their experiences and ideas that readers can gain...
Offshore Installation Vessels Stability Considerations
OFFSHORE INSTALLATION VESSELS STABILITY CONSIDERATIONS By Alan Crowle, BSc, MSc, MScbyRes, CEng, CMarEng, FRINA, FMAREST, FSCMS University of Exeter, College of Engineering, Renewable Energy Group INTRODUCTION The temporary phases of an offshore structure transport...
TheNavalArch Interview Series: Mr Victor Valera
TheNavalArch's Interview Series is an endeavor to get insights from the best engineering and business brains in the industry and present them to its users for the larger benefit of the maritime community. Leaders share their experiences and ideas that readers can gain...
TheNavalArch Interview Series: Mr Steven Lu
Mr. Steven LuManaging DirectorEpoch Offshore Engineering (Shanghai) Co., Ltd. TheNavalArch's Interview Series is an endeavor to get insights from the best engineering and business brains in the industry, and present them to its users for the larger benefit of the...
TRANSPORT VESSELS FOR FLOATING WIND
By Alan Crowle, BSc, MSc, CEng, CMarEng, FRINA, FMAREST, FSCMS Masters by Researcher, University of Exeter, College of Engineering, Mathematics and Physical Sciences, Renewable Energy Group SUMMARY Floating wind turbine construction is a large logistical exercise. The...
TheNavalArch Interview Series: Mr. Balakrishna Menon
Mr. Balakrishna MenonEngineering Director Mooreast (Asia) Pte Ltd TheNavalArch's Interview Series is an endeavor to get insights from the best engineering and business brains in the industry, and present them to its users for the larger...
Floating Rice Fields, the quest for solutions to combat drought floods and rising sea levels
by Lim Soon Heng, BE, PE, FSSS, FIMarEST Founder President, Society of FLOATING SOLUTIONS (Singapore) Abstract Amazing as it seems, there is a case for growing rice on floating platforms in the sea. The capital expenditure to develop this is offset by the opportunity...
CAPSIZE OF LIFTBOAT IN TRANSIT
This paper was originally presented in the 27th Offshore Symposium, February 22nd, 2022, Houston, Texas Texas Section of the Society of Naval Architects and Marine Engineers It has been reproduced here for the readers of TheNavalarch INTRODUCTION In 1989 a Class 105...
.
I would like how calculate catenary
Desires to have a calculating procedure for the tow rope while towis a vessel by TUG
Desires to have a calculating procedure for the tow rope while tow is a vessel by TUG
Hope you are all well.
We are Energetics Technology based in Derbyshire.UK.
We specialise in Pyrotechnic mechanisms and devices.
Our Range includes Cable cutters -Used in the marine indusrty across the globe from ROV and Tailfish snagged lines to Safety release.
Our Cable cutters are Available in several sizes.
All our products are ISO 9001 Certified and our cutters are manufactured from stainless steel for better protection from the elements.
We have several different sizes to suite .
Please visit our website for our complete product range.
http://WWW.ENERGETICS-TECHNOLGY.COM.
Drop me an email for more information.
Kind regards,
Stuart
Buenas noches
Que bueno contar con personas como ustedes que brindan conocimiento a la gente de mar
Estoy interesado de aprender a calcular la catenaria de un cable en un tren de remolque
gracias
Dear Robinson, thanks for the appreciation.
Please note below:
The catenary shape results from the balance between the cable’s weight and the horizontal towing tension.
Its depth and curvature depend on the cable’s weight in water, towing tension, and length.
Understanding the catenary helps predict line tension, sag, and clearance between the towline and seabed.