Why do we need wave analysis?
For the design of offshore operations such as installation and transport of offshore structures, as well as lifecycle design of floating and fixed structures, knowledge of extreme waves as well as the probability of different sea-states is of paramount importance. Before the start of a project or an operation, a reliable meteorological forecast is required to understand the severity of wave load as well as the determination of damage due to fatigue. Since the waves are irregular, the information is provided in terms of statistical terms such as significant wave height (Hs), zero-crossing period (Tz), and their joint probability distribution. These data are usually supplied by various agencies which assess the information based on various sources of data such as wave buoy and met-masts, which have been extracted from years and years (more than a century!) of data, nautical information, and few extrapolations to neighboring regions or coasts using SWAN models. While such data is of high quality and reliable, the data come at a high cost.
Such high costs are sometimes not born by the vendor in the tender phase or for an innovator, during the concept phase. Further, as the projects are moving outshore, it may not make financial sense to install transmitting met-mast at remote locations for a pre-feasibility stage. As a result, sometimes it is wise to utilize the database of previously recorded and simplified data at an early stage to create a business case. There has been an attempt to parametrize the wave statistical data to make it understandable for people involved in wave load analysis.
There is an immense amount of data belonging to various Metocean groups as well as asset owners of oil and gas firms who have performed comprehensive modeling of the project area. Typically, wind, wave, and tidal analyses are performed for the area. The user is provided with “Operational” limit and “Extreme” limits depending on the severity of the design constraints. Although the data is highly proprietary, sometimes the data is contributed to the wider community for a global understanding of the wave environment. The International Council of Exploration of Sea (ICES) is one such collaborative effort towards a large data center managing global marine data sets. For the designers, a spatial and long-term wave statistic with extreme value estimation would be useful.
How is the wave data analyzed and presented?
With plenty of short-term wave statistical data available from shared information, long-term wave statistical data has been developed through various theoretical studies. The long-term variation of wave climate can be described in terms of generic distributions or in terms of scatter diagrams for governing sea state parameters such as (HS, Tz, θ) or (Hs, Tp, θ) that are interpreted from available data.
A scatter diagram provides the frequency of occurrence of a given parameter pair (e.g. (Hs, Tz)). The generic models (“Equivalent storm”) are generally established by fitting distributions to wave data from the actual area. When fitting probability distributions to data, different fitting techniques can be applied; notably Method of Moments (MOM), Least Squares methods (LS), and Maximum Likelihood Estimation (MLE).
DNVGL recommended practice DNVGL-RP-C205 recommends another approach called Conditional Modelling Approach (CMA), in which a joint density function is defined in terms of a marginal distribution and a series of conditional density functions. The significant wave height is modeled by a 3-parameter Weibull probability density function and the zero-crossing wave period conditional on Hs is modeled by a lognormal distribution. This approach is used to make a generic scatter plot correlating Hs and Zero-crossing period (Tz) for various locations.
What is the Global Wave Scatter Generator program?
TheNavalArch has developed its own light-weight “Global Wave Scatter Generator” (GWSG) program for the purpose of first-observation of expected oceanic climate data for offshore analysis. There are 104 locations (bins) identified across the globe. For each location, probability distribution parameters are changed to estimate average prevailing wave statistics in the area.
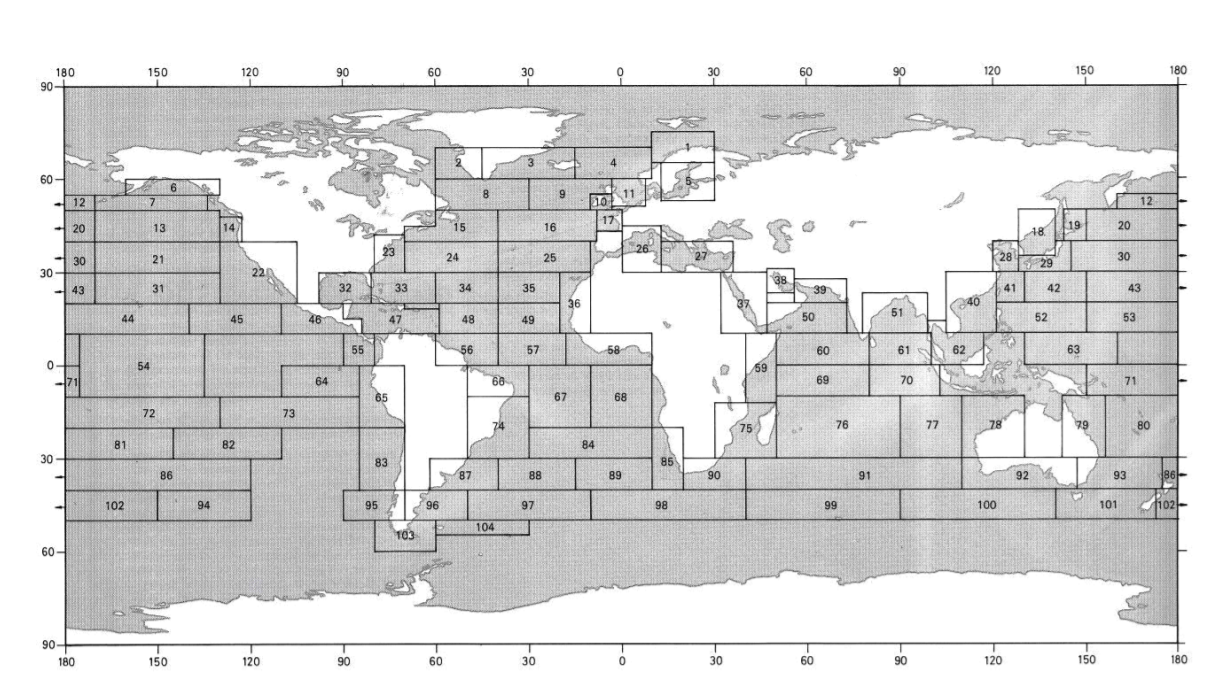
Figure 1: Nautical zones for estimation of long term wave distribution parameters
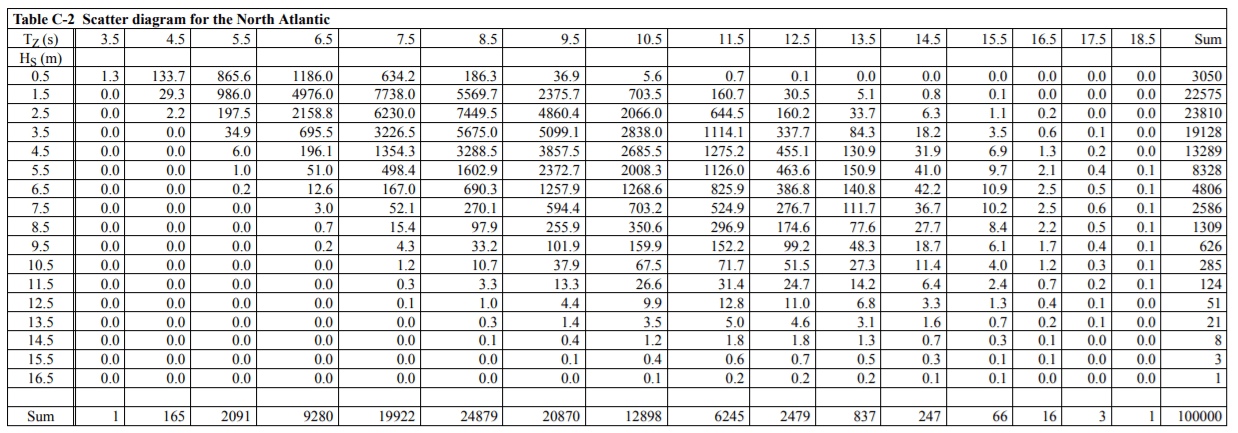 Figure 2: Example scatter table for the North Atlantic area
The method also allows the user to identify extreme wave data such as a 10-year or 100-year returning storm. This method is considerably reliable (although not accurate) to understand the severity of the weather in the area. This can also be used to identify a service limit (operational limit) and the design limit of any operation. Also, a direct application is to identify fatigue damage of a product. Multiple software like OrcaFlex also utilizes the scatter data to create useful analysis involving cumulative load evaluation.
As a responsible engineering team, it must be emphasized that the GWSG program is directly based on DNVGL formulations and is only the average representation of the wave conditions in an area. However, for the projects with high liability, actual metocean reports must be referred to.
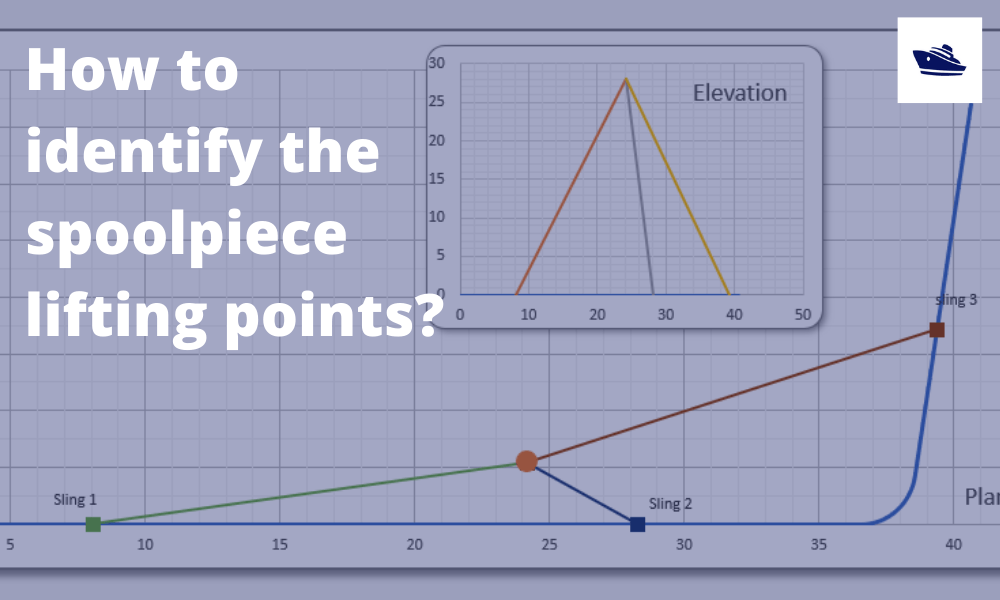
How to identify the spoolpiece lifting points?
In the offshore construction industry, the connection between the newly installed pipeline and the riser is accomplished via a series of ‘spoolpieces’ (or spools). The spool is fabricated by welding pipe joints to form an L-shaped, Z-shaped, or possibly a straight...
The importance of clear decision support before marine operations
Our oceans are interspersed with human activities: be it fishing, marine transportation, or offshore operations. These operations usually involve assets worth multiple million dollars, be it the produce or the equipment or in most cases, the human life. Produce from...
Sea Pressure Loads Calculation based on DNV Rules
Introduction Sea pressure loads are an important factor in the structural design of a vessel. What is sea pressure load? As the term suggests, it is the external pressure on the vessel due to the surrounding sea. What kind of pressure it is, and how to...
A quick empirical method for resistance estimation of planing vessels
Resistance estimation for a vessel is a fundamental exercise in design of the vessel. Resistance is a property that depends on the vessel’s shape and form. A conventional ship-shaped vessel with a bulb will have completely different resistance characteristics compared...
Powering the maritime industry with Hydrogen – Part 2
Powering the shipping industry with hydrogen - Part 2: Hydrogen propulsion on a ship - opportunities and challenges Introduction In the Part 1 of this article, we explored the basic properties of Hydrogen as a fuel, and also the opportunities and challenges...
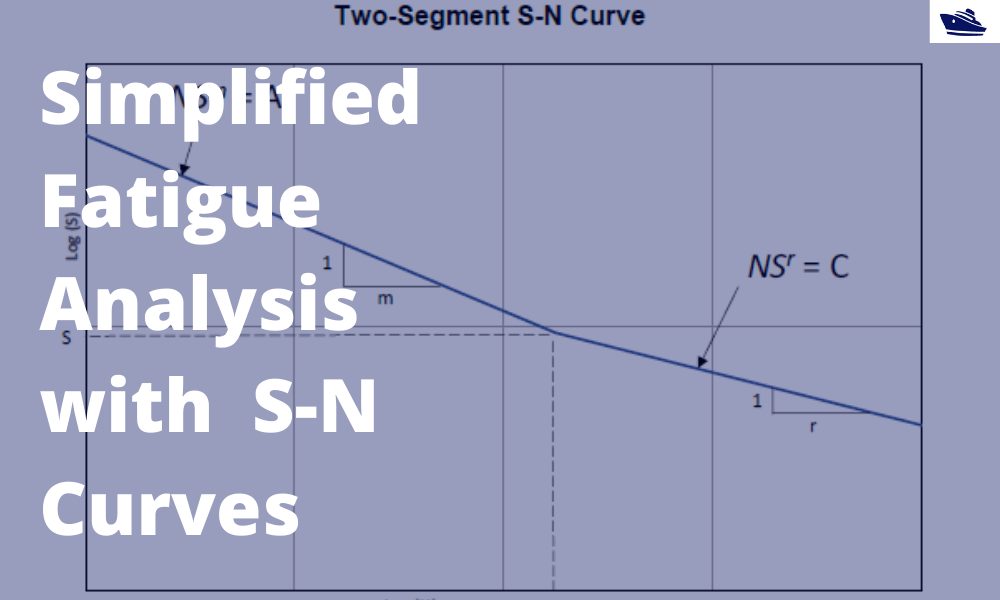
A simplified method of performing fatigue analysis of offshore structures
A simplified method of performing fatigue analysis of offshore structures Introduction An offshore structure is subject to environmental loads of waves, wind and current. By their nature, the resulting wave loads on the structure are cyclical. These cyclical...

Powering the shipping industry with hydrogen: opportunities and challenges (Part 1)
Part 1: About Hydrogen – Basics, Opportunities, and Challenges Of late, hydrogen has been generating quite a buzz in the energy sector with its possibility as a clean source of energy. The shipping sector is not untouched, and this article explores the possibilities...
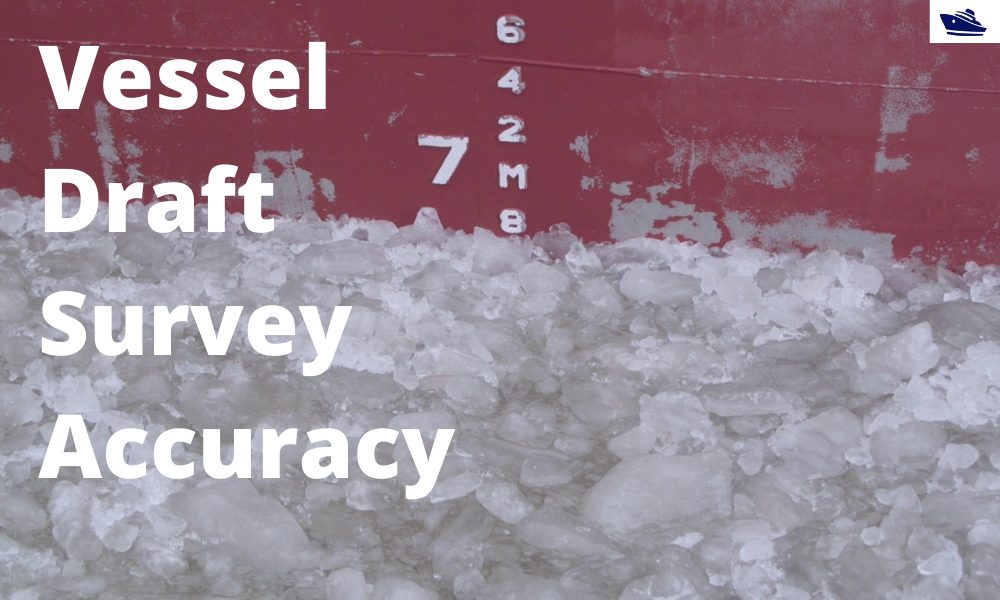
Vessel Draft Survey Accuracy
by Chris Zeringue, Owner, MTS Marine Techincal Surveyors The key to accuracy in a Vessel Draft Survey may very well be found in a hole in the ship. I boarded my...
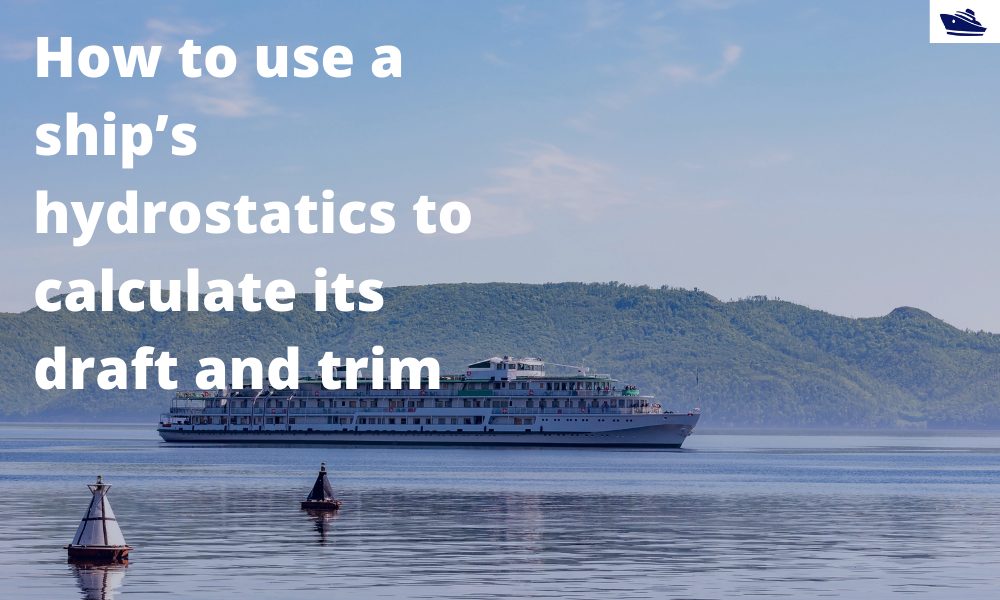
How to use a ship’s hydrostatics to calculate its draft and trim
Introduction A ship’s hydrostatics, or hydrostats, is an oft used term in maritime parlance, and it refers to the characteristics when it is floating. What characteristics are these? How are these determined, and how can we read and understand them? Understanding...
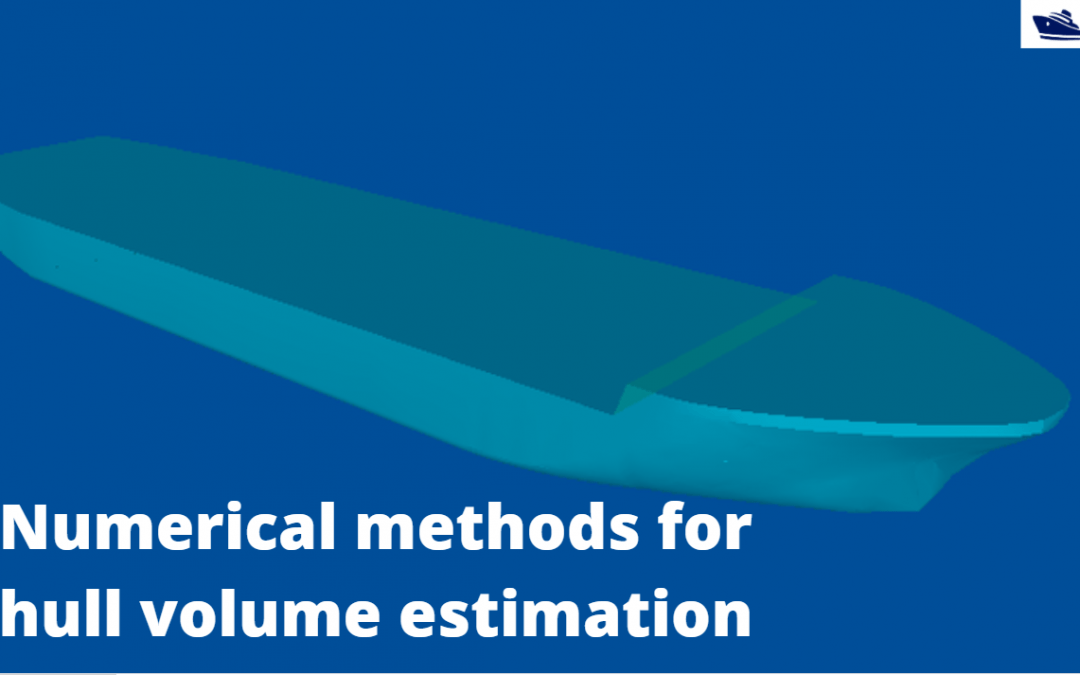
Numerical integration methods for hull volume estimation
Introduction The hull of a ship is a complex 3D geometry, and finding out its simple properties like volume, centroid, etc. is not possible through simple formulae unlike standard shapes like cuboid or a cylinder. How do we find a property, say the volume of a...