1 Abstract
A semi-automated structural weight optimization system is presented for framed structures of post and beam construction which is based on basic structural member design principles. The approach is to adjust member properties in a manner that optimizes member strength capacity as characterized by “unity check” values. The method is illustrated and the effectiveness of the optimization strategy demonstrated with two case studies based on real-world designs that the authors have been involved with. Possible applications of the method to assist facility-owner’s structural engineers in their work are suggested. The value of carrying out this method can be related to the estimated unit cost of installed structural steel. Strengths and potential weaknesses of the method are noted. Future articles are planned to present more case studies and learnings from same.
2 Introduction
Framed structures consisting primarily of structural members are common in a wide range of industrial facilities both onshore and offshore. Optimization of their weight to minimize cost of material and construction constraints is frequently of interest to facility stakeholders. In the case of offshore structures, the latter consideration can include limited installation crane lift capacity or small margin on floating stability compliance
A semi-automated system (referred to herein as the Optim22 method) to assess weight-optimization of modules of standard post-and-beam construction is presented in this article. It is intended for use in the following applications:
- Assess structural analysis models provided to facility owners by 3rd Party design consultants with regard to modelled structure weight
- Generate more reliable Concept and FEED primary structure estimates than generally available using weight norms that are often based on limited data.
By employing member design basic principles and adjusting member section properties in a controlled manner, a structural model of given configuration can be iteratively “unity-check” optimized to section-specific target unity check values. By implication this is expected to lead to weight-optimized designs for given structural configurations.
A three-stage optimization process is described herein where the latter two are automated using VBA code. It is noted that the optimization process can lead to either lower structural model weight or higher depending on whether the starting model is design-compliant or not. There are a relatively large number of calculation steps in the overall process so that the method is only claimed to be feasible because it is highly automated. Further automation is an ongoing effort as the opportunity arises.
Two offshore facility topsides modules case studies are presented to illustrate use of the method, one for a recently delivered 100,000 bbl/day FPSO and the other for a planned 150,000 bbl/day FPSO currently in FEED.
It is noted that although the basic method is currently tailored to offshore topsides modelled using the SACS program, it could be adapted to any structural analysis program that utilizes text file input(s) and generates an output text file containing member unity check results. Similarly, the range of models that could be handled by the system is not restricted to those of FPSO topsides modules or even offshore platforms.
3 Setup Considerations
Steps 1 & 2 of the Optim22 process are performed to prepare the structural model of interest for input to the main algorithm executed in Step 3.
Step 1: Strengthen any modelled members that are severely over-stressed eg. UC > 1. (This reduces the number of Step 3 iterations required to produce a “fix” for such members.)
Step 2: Analyze the model resulting from the Step 1 adjustment. Split any member Grups into two Grups where the spread between maximum and minimum member UC exceeds a user-defined target value.
4 Heuristic Analysis
The following discussion applies to the 3rd stage of the optimization process introduced above.
A heuristic approach is taken here to examine the key parameters that affect structural member design compliance. A mathematically-rigorous procedure would involve defining a to-be optimized mathematical “objective” function eg modelled structural weight together with “constraint” equations e.g. member design criteria and such a method has been presented in Hughes “Ship Structural Design – A Rationally-based, Computer-Aided Approach”. In the method presented here, the design (performance) constraints are contained in the structural analysis model of interest which is solved in an iterative manner by subjecting it to small adjustments at each iteration step until an “acceptable” solution is obtained.
In all structural member design codes, a total member unity check (UC/utilization) parameter is established and is assigned a maximum allowable value (usually 1.0) depending on design condition. This parameter is nominally a sum of tension/compression effects and bending effects about two orthogonal axes ie
UC_Tot = UC_ax + UC_yBend + UC_zBend {eq 1}
(Notations are presented in Table 1 below.) Although eq. 1 applies strictly to only individual members, it is applied here to “Member Groups” i.e. sets of modelled members with common material and section properties. A “sum of components” unity check parameter is defined as
UC_SoC = UC_ax-M + UC_yBend-M + UC_zBend-M {eq 2}
where UC,ax-M, UC,yBend-M, and UC,zBend-M are the “envelope” maxima for a Grup and where SoC means “sum of UC components”. Note that for “Grups” of members, individual member UC_tot,max over all members in the Grup is less than or equal to UC_SoC.
At each analysis iteration during the Stage 3 optimization, structural member Grup section properties are adjusted by small increments/decrements in their Ax, SMy and SMz to minimize load re-distribution at each iteration. The objective is to “steer” the UC_SoC,j values at each iteration “j” toward an end target value (e.g. 1.0) by adjusting the component axial, y-Bending and z-Bending UC’s individually at each step. Candidate members meeting all component targets are identified in pre-defined member section databases and the “optimal” section is selected, namely the one with smallest area ie the “lightest” one.
Table 1- Definitions and Nomenclature
| Term | Meaning | Term | Meaning |
| Grup | Set of modelled members with common material and section properties (Note: “Grup” is SACS program terminology.) | ALARP | As low as reasonably practical |
| UC | Unity Check value/ratio (nominally a calculated value divided by an allowable value) | ||
| UC_Tot | Total Unity Check | UC_SoC | Sum of component UC’s (see eq. 2) |
| UC_ax | Axial (tension/compression) component of total unity check value | UC_ax-M | Maximum UC_ax over all members in a “grup” |
| UC_yBend | Member local y-axis bending component of total unity check value | UC_yBend-M | Maximum UC_yBend over all members in a “grup” |
| UC_zBend | Member local z-axis bending component of total unity check value | UC_zBend-M | Maximum UC_zBend over all members in a “grup” |
| Ax, | Member cross section area | CoG | Center-of-gravity |
| SMy | Member Section Modulus with respect to local y-axis bending (generally strong axis of I-shapes) | ||
| SMz | Member Section Modulus with respect to local z-axis bending (generally weak axis of I-shapes) | ||
5 Methodology
As noted in Section 3, the overall optimization method presented here involves three stages of structural model adjustments where the purpose of the first two is to set up the third with the goal of reducing the number of analysis iterations to be run. It requires that a base model including all desired analyses be set up in advance. This “starting” model may be produced by 3rd parties as well as by TeamNavalArch. The procedure is summarized in Figure 1 below followed by details of the steps involved.
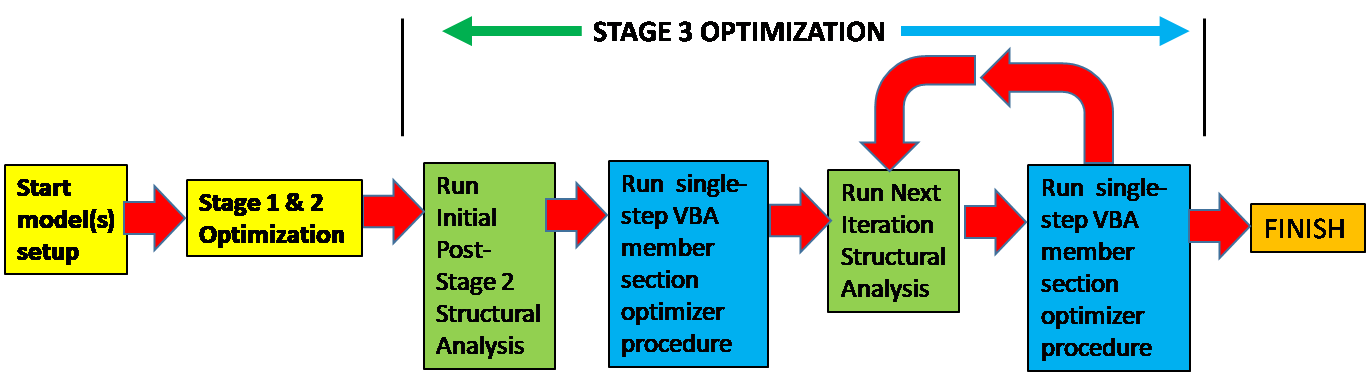
Figure 1- Structural Analysis Models Optimization Procedure
- Stage One. Run the base model through its latest analysis and make the following adjustments
- identify member groups that are severely over (or under) designed and assign member sections with smaller (or higher) section property values accordingly. (One could also consider increasing or decreasing the Grup’s assigned material yield strength, Fy, though this is not the Developer’s typical practice.)
- Identify critical load transfer paths and define separate member Grups for these e.g. in way of module supports, particularly where there are relatively few of these.
- Stage Two. Run the first-stage adjusted model through its analysis and identify Grups where there is a relatively large spread between the maximum and minimum UCtot. Grups exhibiting a min-max spread over a (user) specified threshold value are split into two parts – an upper part and lower part and the new Grups are assigned to affected individual members accordingly.
- Stage Three. Run the model iteratively through its analysis (starting with its second-stage adjustment version) and pick out its member unity check results. Structural member Grup section properties are optimized in an iterative manner via small increments/decrements in their Ax, SMy and SMz values in order to minimize load re-distribution effects at each iteration. The objective is to “steer” the UC_SoC,j values at each iteration “j” toward the end target (e.g. 1.0) by adjusting the component axial, y-Bending and z-Bending UC’s individually at each step. Finally, select the “candidate” with smallest area ie the “lightest” one at EACH analysis iteration. The following calculation steps are carried out:
- Step 1. Establish “global” end target UC_SoC values (including “modification” factors for individual Grups to permit some flexibility in final choices.)
- Step 2. Establish “global” NEXT ITERATION target UC_SoC’s by developing an estimate for each of its COMPONENT terms
- Step 3. For each Grup “k”, establish incremental changes in Ucax-M, UC_y_Bnd-m and UC_z_Bnd-M (ie dUCax,k, dUC,k_yBnd,k & dUC_zBnd,k)
- Step 4. Determine the new member sections to be assigned to the member Grups being adjusted in the next analysis iteration. Their Ax, SMy and SMz are established by simple linear relationships with the next iteration targets for Ucax-M, UC_y_Bnd-M and UC_z_Bnd-M respectively. The selected member section at each iteration is the one with the smallest Ax that meets the target Ax, SMy & SMz.
- Step 5. Update the structural model input file(s) with the updated section data and run the next structural analysis iteration
- Repeat Stage 3 Steps 1-5 above until an acceptable result is achieved. The ideal is where the modelled structural weight (and CoG) is not changing but sometimes one needs to settle for minimal overstress in the member UC plots due to project time constraints. Ie member failure eradicated to ALARP.
In the Optim22 method, each Stage 3 iteration is fully automated while a macro-assisted workbook is available to execute Stage 2 for a given structural model and set of member unity check results. Depending on the care taken to develop the base model used as input for the process here, Stage 1 work can also proceed quickly.
The overriding key objective of the method is to achieve results rapidly i.e. within a couple of days or less. To a large extent this is driven by the number of optimization iterations required. Three key factors affecting the number of iterations required in the optimization process are:
- The number of member section properties utilised along with their distribution in the starting model (referred to also as Iteration “OO” or IterOO.)
- The degree of member section size change between iterations i.e. the smaller the step-size, the more iterations required.
- The range and types of member sections available in the built-in section databases. Presently available sections are built-up “I” & Box shapes, wide flange and tubulars.
Regarding Point 2, it has been observed that better control of the optimization process is achieved if only a small degree of member section size change between iterations is allowed. This tends to increase the number of iterations required for section assignment optimization but is accepted for the sake of stability of the process. It is noted that the present optimization algorithm can handle relatively large changes in section size for uniformly loaded models with many supports but doesn’t do as well for models featuring significant load transfer gradients.
One final note on the criticality of the number of optimization iterations required is that it does not matter so much if the “run-optimize-run” sequence in Figure 1 can be executed by a single program without user interaction at each iteration step. At the time of writing, this capability is now included in the SACS program as of v13.1. The Developer has also had this capability provided by Sesam suite developers by special request in the past.
6 UC Components Increments Selection
Further details regarding determination of the UC increments will be provided in a near-future article.
.
7 Case Studies
7.1 Overview
Two case studies have been carried out to illustrate the Optim22 optimization process. These are based on two relatively large FPSO modules from different facilities with one model produced by a third party and the other by a TheNavalArch.com team member. The former module model is based on AFC design and features Seawater Systems equipment (including Water Injection Pumps) while the latter is a FEED design planned to house a few large (> 100MT) compression equipment packages.
The structural analyses in both cases are performed using the SACS software. Primary structure is modelled by beam members and “heavy” equipment weights are represented explicitly. Design conditions considered are Lift, FPSO transit, one-year operating, 100-year storm, and FPSO static heel and trim in a damage condition. The structural loading derives primarily from “weight” i.e. gravity and inertia due to FPSO motions though wind load is also considered. Fatigue of welded-connections is not considered. In both analyses, module weight is invariant at each optimization iteration except for the modelled structure since it is subjected to the optimization process presented above.
In both cases, the effectiveness of the optimization strategy is demonstrated by Before-Vs-After member “Grup” maximum unity check value comparisons. For both case studies, the target “Total” member UC value was set as 1.0.
7.2 AFC Status Seawater Systems Module
This model served as the basis of the AFC design verification for a recent FPSO delivery project. It was produced by the owner’s design contractor in accordance with owner’s topside structural design specification. Development of this model took place over a 14-month period so it became very detailed as illustrated in the shot of its PDMS model presented below and was manually optimized over time to the available design data by the assigned structural engineers.

Figure 2- PDMS model for Seawater Systems Module
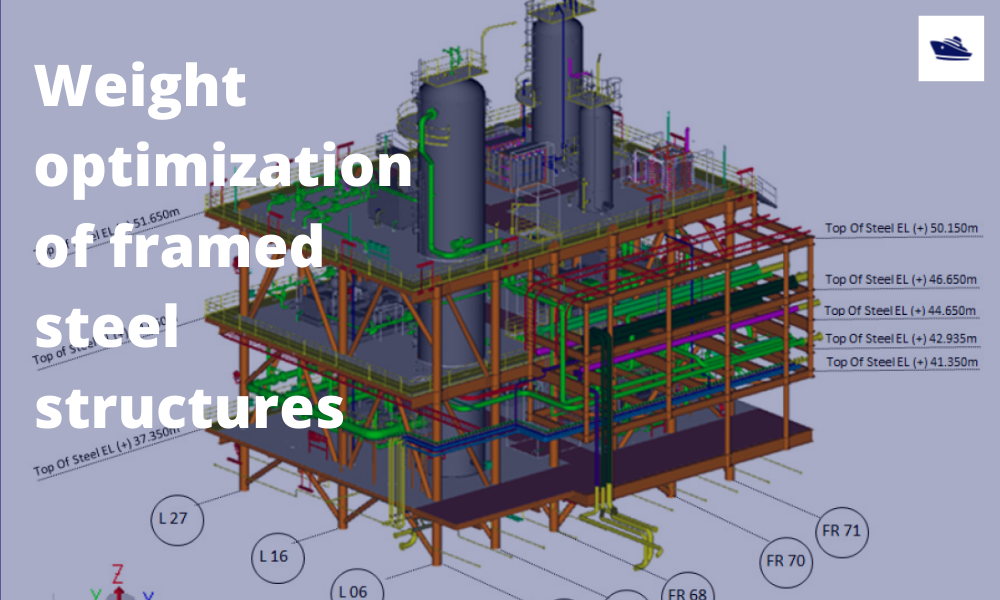
The module structural analysis model features three main deck levels and the support system is a “multi-point” system of rigid and flexible stools in a 5×3 (rows) stool arrangement. The lift points are located on the upper deck. Although the lower level is presumed to be plated, its contribution to the global strength is not considered in the analysis i.e. it is treated as secondary steel. This model is shown in Figure 3 and total dry and operating weight considered was 1600/1900 MT.
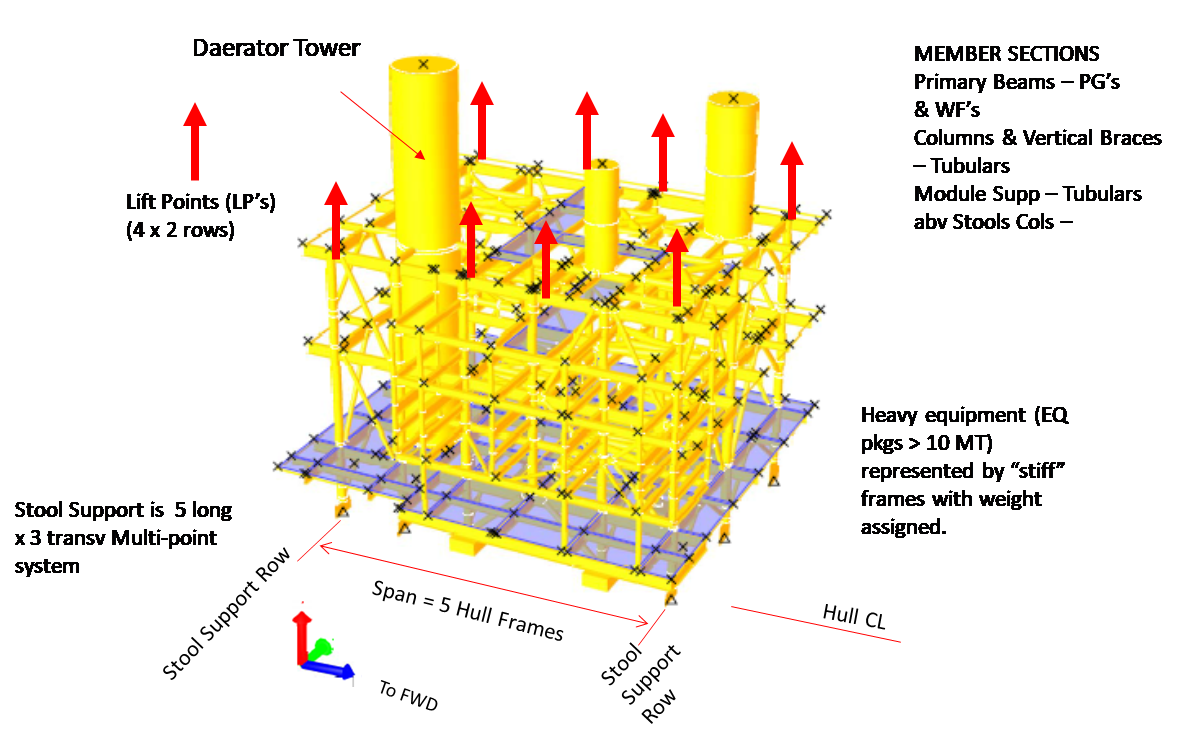
Figure 3- SACS model for M52 Module
The overall analysis results at the “Start” of Stage 3 optimization and after 11 iterations is shown in Figures 4 and 5 where it is noted that “grey” indicates member unity check (UC) of less than 50% of capacity while the spots of “red” indicates members that are failing their design criteria. In this case, the “optimization” is upwards as the starting model featured member failures in way of the Module supports. The grey areas in the after-Stage-3 indicate potential for further optimization.
.
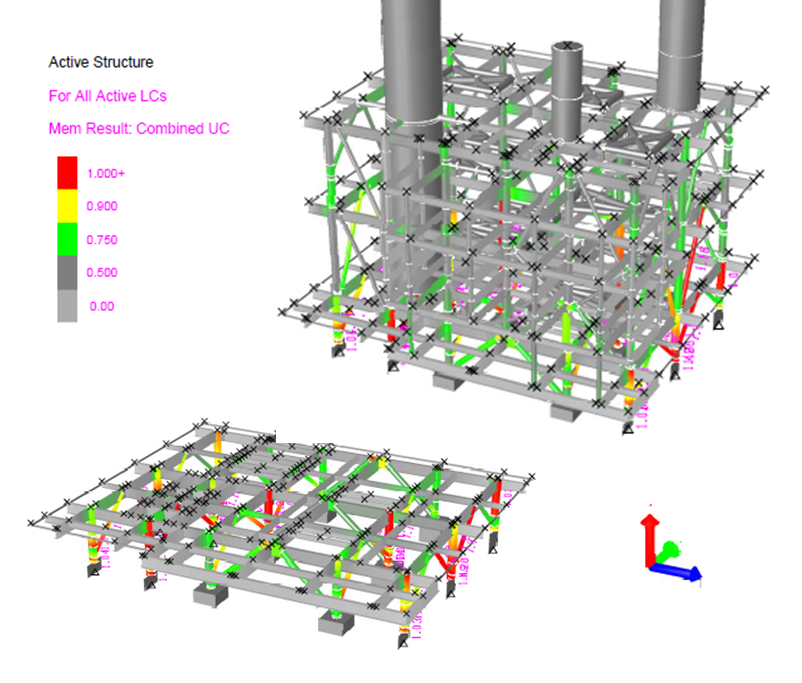
Figure 4- Module M52 Strength Analysis Member Unity Check Result PRIOR to Stage Two Optimization (Modelled Structure weight = 3986 kN)
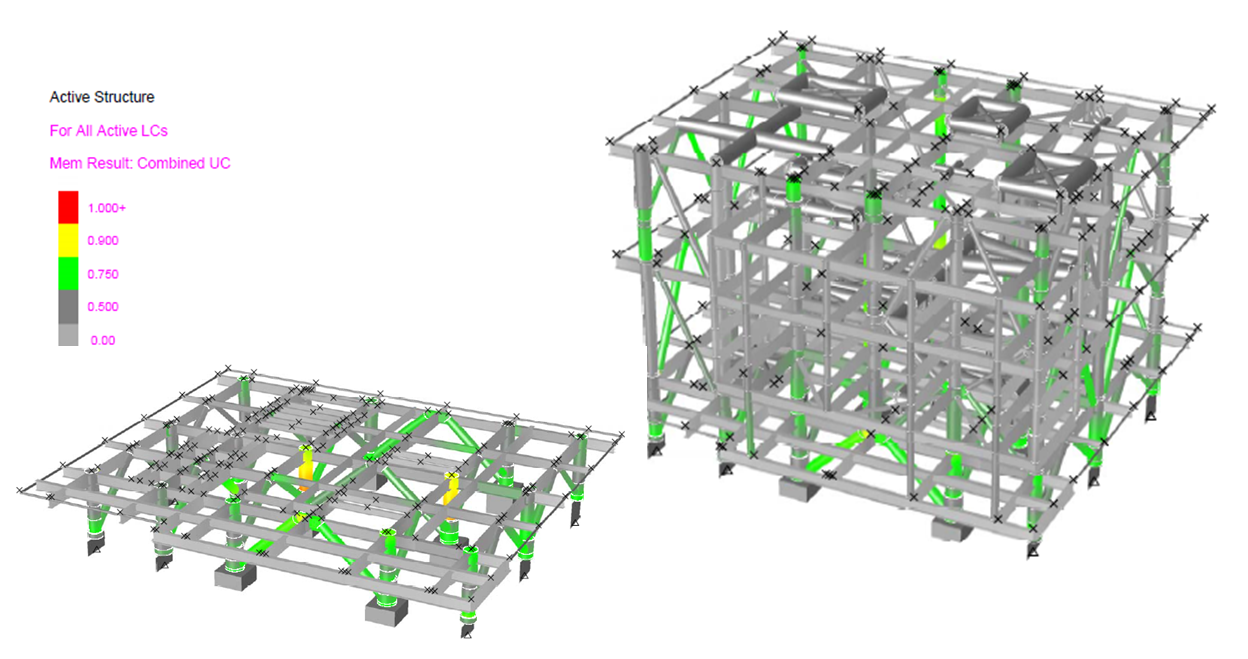
Figure 5- Module M52 Strength Analysis Member Unity Check Result after 11 (Stage 3) Iterations (Modelled Structure weight = 4236 kN)
It is noted that the difference in modelled structure weight between the start and end is about 25 MT. The progression of modelled weight at each iteration step of optimization process is shown in Figure 6. After the 11th iteration, this weight (as well as its CoG location) remained constant so is considered an optimal solution.
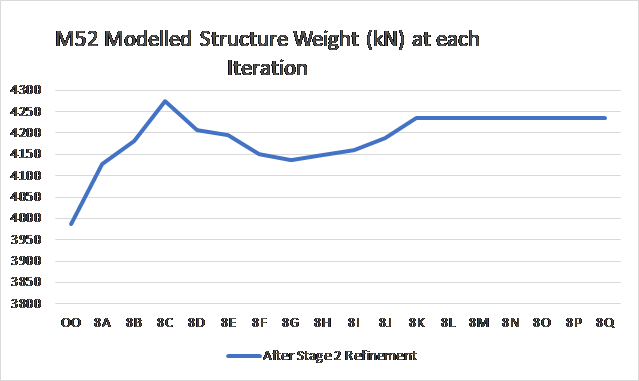
Figure 6- M52 Modelled Structure Weight At Each Optimization Step
To demonstrate the effectiveness of the M52 optimization strategy, a Before-Vs-After member unity check comparison is presented in Figure 7. The “blue” curve shows the “before Stage 3 optimization” value of the maximum member UC in each active member “Grup” noting that there are several “Grups” featuring overstressed members. The “red” curve shows the corresponding “after” value noting that the ideal result would be a horizontal line at UC = target value (which in this case is 1.0). It can be seen that the UC result for each “Grup” has been “steered” toward the target, particularly the overstressed values in the “Before” case.
.
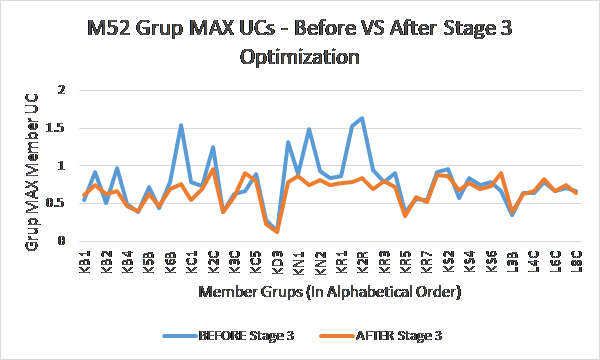
Figure 7- M52 Member Grup Maximum UCs – Before VS After Comparison
7.3 FEED Status Gas Compression Module
This model served as the basis of FEED comparison design for Module ZP3 in an FPSO project going through FEED stage. It was produced by a TheNavalArch.com team member based on concept phase (Pre-FEED) topsides equipment list, weight report and modules general arrangement. The structural design specification of the Owner’s design contractor was followed with appeal to the analyst’s structural design specification for modelling requirements not covered. Development of this model took place over a 1-week period though it was detailed enough to include deck footprint beams for equipment groups greater than 10 MT.
The structural framing concept is “post and beam” construction and the support system features Six elastomeric supports in a 3×2 (rows) stool arrangement where the longitudinal span between transverse rows of supports is four ship frames. The lift points are located on the upper deck as indicated in the figure. Same as for M52, the contribution of the plated lower level is presumed to not contribute to the global strength in the analysis. This model is shown in Figure 8 and total dry and operating weight considered was on the order 2220/2480 MT.
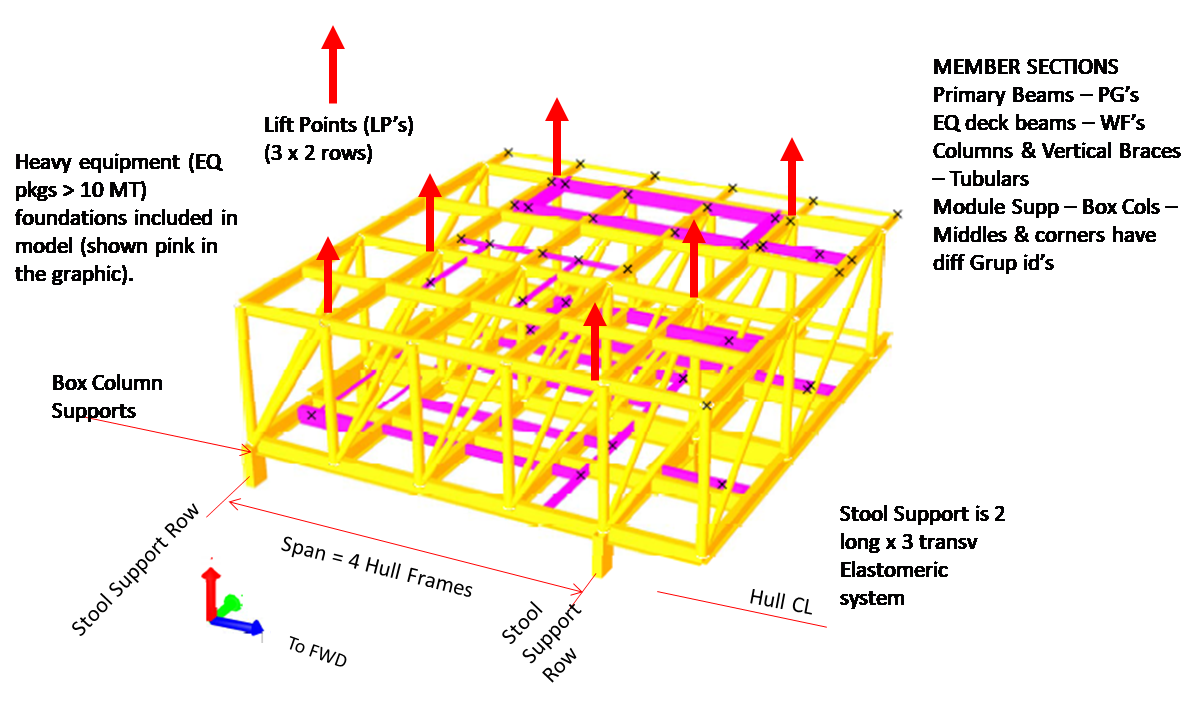
Figure 8- SACS model for ZP3 Module
The overall analysis results at the “Start” of Stage 3 optimization and after 13 iterations is shown in Figures 9 and 10 where it is noted that “grey” indicates member unity check (UC) of less than 50% of capacity while the spots of “red” indicates members that are failing their design criteria. In this case, the “optimization” is upwards as the starting model featured member failures in way of the Module supports. The grey areas in the after-Stage-3 indicate potential for further optimization.
.
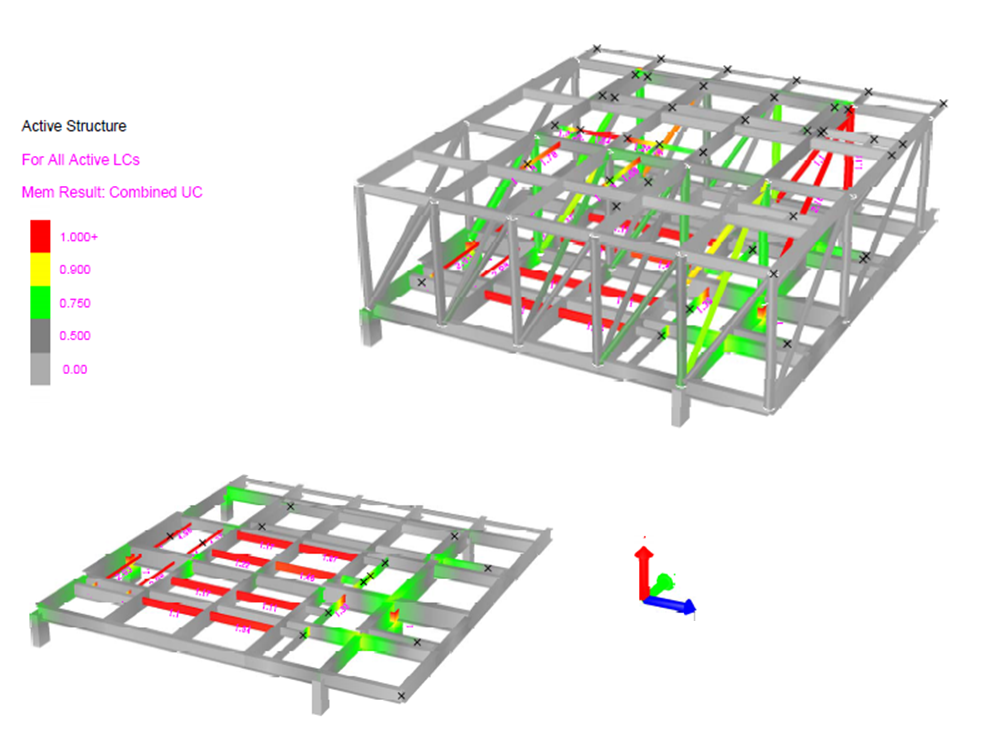
Figure 9- Module ZP3 Strength Analysis Member Unity Check Result PRIOR to Stage Two Optimization (Modelled Structure weight = 5413 kN)

Figure 10- Module ZP3 Strength Analysis Member Unity Check Result after 13 (Stage 3) Iterations (Modelled Structure weight = 5462 kN)
For this case, the impact of each of the three optimization stages is examined more closely in Figure 11 where the progression of modelled weight at each iteration step of optimization process was tested for the following sub-cases:
- No Stage 1 & Stage model refinement ie Stage 3 Optimization only
- Stage 1 refinement only followed by Stage 3 optimization
- Both Stage 1 and Stage 2 refinement prior to Stage 3 optimization
The benefits of executing both Stage 1 and Stage 2 are illustrated in Figure 11. For the sub-case (i) (the “blue” curve) the modelled structure weight did not level off after 15 iterations although the rate of change is decreasing. In sub-case (ii), (i.e. the “red” curve) the modelled weight levelled off after 10 iterations. Sub-case (iii) where all three stages of optimization are carried out yields an optimal solution after 11 iterations and a lower value than that achieved for sub-case (ii) where the Stage 2 optimization was skipped.
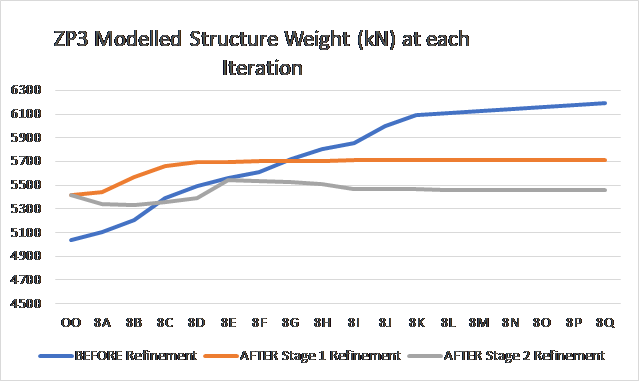
Figure 11- ZP3 Modelled Structure Weight At Each Optimization Step for Three Optimization Process Tests
To demonstrate the effectiveness of the ZP3 optimization strategy, a Before-Vs-After member unity check comparison is presented in Figure 12. As in the M52 case study, the “blue” curve shows the “before Stage 3 optimization” value of the maximum member UC in each active member “grup” and the “red” curve shows the corresponding “after” value again noting that the ideal result would be a horizontal line at UC = target value (1.0). It can be seen that the UC result for each “grup” has been “steered” toward the target, particularly the overstressed values in the “Before” case.

Figure 12- Module ZP3 Member Grup Maximum UCs – Before VS After Comparison
8 Concluding Remarks
- Present implementation. At present the method has been developed for use in conjunction with the SACS structural analysis program.
- Automation of structural analysis execution. With this feature, the method here can theoretically accommodate runs featuring hundreds of optimization iterations if so desired. This lessens to need to spend time on Stage One optimization. (In practice a limit of 25 iterations is currently set so that mid-sized modules can be optimized in an overnight time frame.)
- Constructability of weight-optimized designs. Optimum construction generally occurs when there are relatively few member sizes and material grades to deal with. The optimization process presented here leads to a minimum weight solution for a given structural configuration. This may not be the optimal cost and schedule solution but at least provides a starting point for a cost-benefit analysis to determine same. It is noted that some organizations estimate the cost of installed structural steel to be around $10k/ tonne depending on market conditions.
- Design schedule. A key selling point for the method described herein is speed of execution. After preparation of the base input model, the optimization process for even very large structural models can be carried out in a couple of days. This makes it feasible to employ it for Concept and FEED design as well as short-duration design reviews.
- Quality of results. In the final tally, the procedure just generates input for a structural analysis program so that no intermediate member section parameter estimates are used in isolation in the design. These are always verified for project requirements in the check of the structural analysis program’s input and analysis output.
- A near future TheNavalArch.com article is planned to provide more details on the optimization parameters and more learnings from additional case studies.
Disclaimer: This post is not meant to be authoritative writing on the topic presented. thenavalarch bears no responsibility for the accuracy of this article, or for any incidents/losses arising due to the use of the information in this article in any operation. It is recommended to seek professional advice before executing any activity which draws on information mentioned in this post. All the figures, drawings, and pictures are property of thenavalarch except where indicated, and may not be copied or distributed without permission.

Michael Harwood
CCnBW at MCHTM Inc
INTRODUCTION:
Forward looking, project-oriented engineer and manager with over 30 years design, analysis and work management/coordination experience mainly in the offshore oil and gas industry. Present focus is on providing customers/employers with designs that are optimized for weight and constructability within cost and schedule constraints. Rapid delivery of these is achieved by automating calculation processes as much as possible, particularly when dealing with interface data from mechanical and piping disciplines. Refer to my recent LinkedIn articles for examples.
CAREER OVERVIEW:
Began as a structural engineering analyst out of university and moved up into hands-on management positions both in operations and projects. Acquired overall knowledge of oil and gas production facilities and gained both US and international experience along the way. Familiar with both owner’s and contractor’s interests so can work as Owner’s Engineer or EPC Contractor PMT member. Became an independent consultant in 2008 working and work through MCHTM Inc or as a contract engineer depending upon what works best for my client. Along the way, have worked on approximately 50 projects and 20 tenders of various durations and produced over 1000 report, drawing, and specification deliverables of varying scope.
GOAL: To have satisfied customers/employers
SPECIALTIES
Specialties: Structural engineering subject matter expert. Expert user of structural analysis computer programs and offshore and ship design codes. Also familiar with subsea equipment structures and installation aids as well as offshore pipeline installation equipment and aids. Brown field and newbuild. Structural engineering planning and management.
Design aid software developer to advance design automation, design work methods planner, construction engineering support. Coach/mentor of junior engineers.
General experience with hull and mooring systems and topsides production facilities on the following offshore platform types: FPSOs; CPTs, Spars; Production Semis; TLPs, MODUs; MOPUs and Fixed Base as well as the following ship types: Drilling, S-lay Pipelay; Naval.

Calculating the maximum stacking height of pipes
Introduction Pipes (or linepipes or joints) are used for multiple purposes and locations in the maritime/offshore industry. Onshore and offshore pipelines are used for transportation of fluids on land, over and underwater. Pipes are fabricated in an onshore facility...
Safe Towing: Calculating a towline’s catenary and sag
Introduction Towlines connect a tug to the vessel being towed and are defined by multiple characteristics like Weight, Diameter, and Stiffness. The tension in the towline during the towing operation is not static but keeps varying with the distance between the tug and...
Designing the lashings of deck cargo using IMO CSS
Introduction More than 70% of the earth is covered by water, which makes shipping historically the easiest and cheapest way of connecting manufactures and customers across the globe and can be reasonably considered to be the artery of the global economy....

Using MS Excel to evaluate the Stability of existing Barges
Barges are the simplest, and yet most widely used of marine vehicles. They are used for a variety of purposes ranging from carrying cargo in bulk or liquid, to even carrying passengers for short inland cruises. Barges are mostly towed by another barge called a tug,...
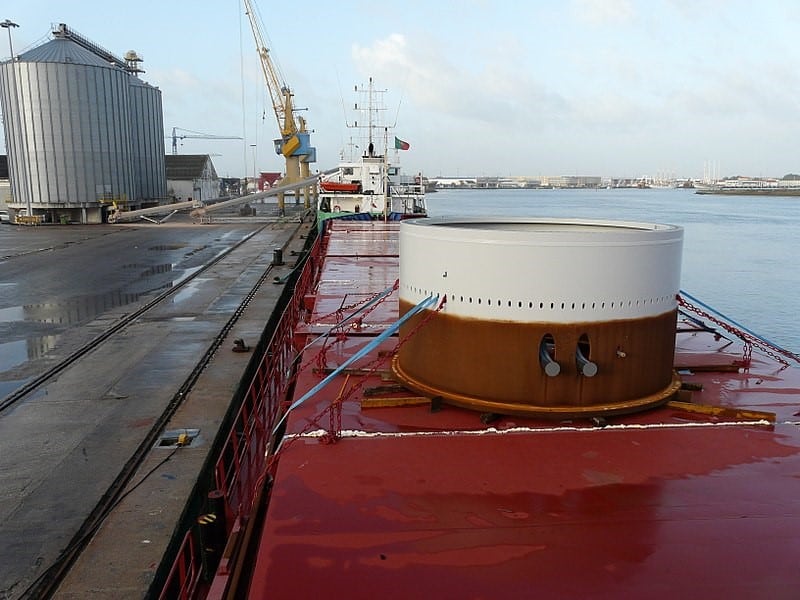
Calculating forces on a ship’s deck cargo – a simplified approach
A cylindrical deck cargo (Source: Wikimedia) Introduction A ship’s deck is used to transport many different types of cargo – from containers to large structures like cranes or heavy modules of an offshore production plant. During transport, the ship suffers from...
Designing a pad-eye: little items with big intricacies
Pad-eyes are one of the smallest and most universally used structural items in the maritime and Oil & Gas industry. They are used for a variety of purposes too: from a simple seafastening of a cargo to deck of a vessel, to complicated lifting operations involving...
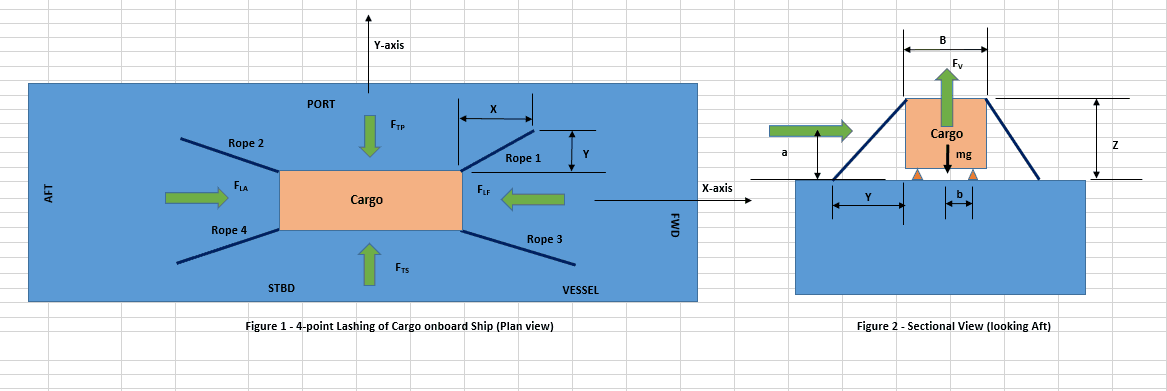
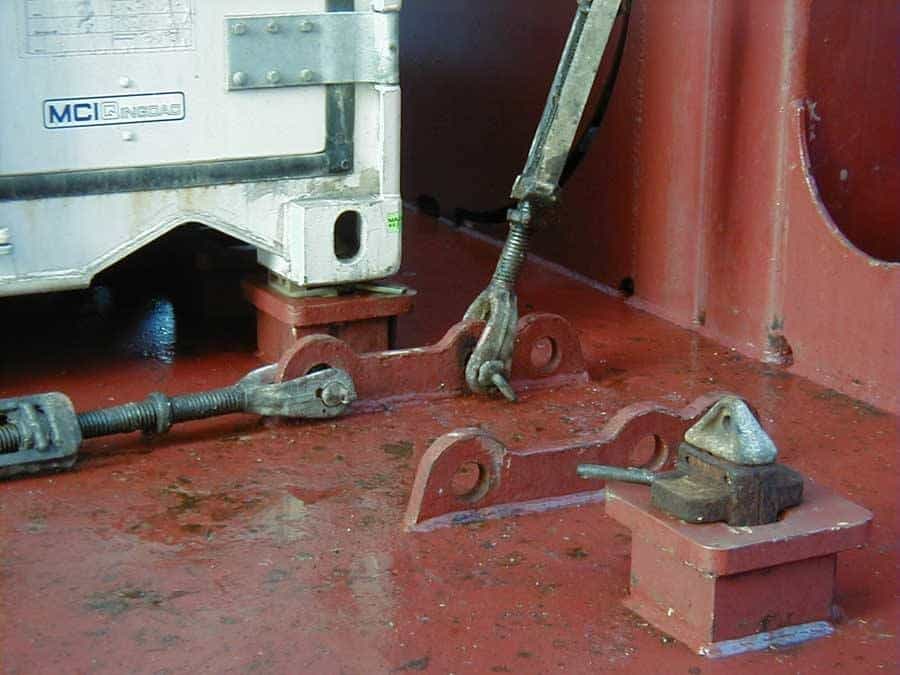
Designing a simple 4-point lashing system for a Deck Cargo
Introduction Lashing of a deck cargo on a ship involves different means and mechanisms to secure the cargo to the deck of the ship. This ‘securing’ is important to contain the movement of the cargo in view of the ship motions during the transportation. The simplest...
Selecting the right equipment for towing operations – Emergency Towing
In Part 1 of the article, we discussed the regular towing arrangements and how to select the towing gear for the same. In this part, we will discuss the components of the emergency towing arrangement and how to select them. The purpose of emergency towing equipment is...
Selecting the right gear for towing operations – Part 1
Towing operations seem pretty straightforward – we just need to connect the vessel to be towed to the right sized tug and get started! However, a simple exercise of digging deeper will reveal critical items that we need to take care of. If we start thinking about the...
Removing Human Error in Ship Performance Analysis
Introduction Shipping is the most dominant means of transport that facilitate global trade. Over 90% of world trade is done by ships[1]. Fuel onboard ships, commonly referred to as "bunkers", has become the largest cost item of a ship's Operational Expenses (OPEX),...
no