Introduction
Shipping is the most dominant means of transport that facilitate global trade. Over 90% of world trade is done by ships[1]. Fuel onboard ships, commonly referred to as “bunkers”, has become the largest cost item of a ship’s Operational Expenses (OPEX), accounting today almost 50% of a voyage cost, even greater than crew wages[2]. This has given rise to interest in understanding the fuel consumption under various condition.
Ship performance analysis means the ability to predict the power and fuel consumption of a ship in any given condition of draft (or displacement), speed and weather condition. When the ship is new, sea trial curves, though with limited speed range and draft range give good estimation. However, for an older vessel, this needs to be estimated from the recent observed data report by the ship either through noon report or real time report. Since the accuracy of the model is dependent on the reported data, error in this would reduce the accuracy of the model.
The following sections focus on the human errors in reports and the means of reducing the same to get a good prediction model. The process of building the model is not covered in the article.
Understanding Ship Performance
Ship performance refers to the propulsion power or fuel in relation to the vessel condition, environment condition and various operating conditions.
From Fuel to Speed and various parameters in between
There are three things that have happened since the ship was new. Firstly since the vessel has aged, the engine performance would have degraded, along with an increase in hull and propeller roughness and distortion. Secondly, the vessel operates in different conditions of the environment compared to the sea trial condition. Thirdly, sea trial is done for design draft and ballast draft, however, during operations, it is scantling draft or fully loaded draft (slightly more than design draft) and in case of container ships a range of drafts between ballast and scantling draft.
The hull and propeller condition can be combined assessed by taking shaft power as input and speed along with environment and operation factors taken.

The major factors in the environment are wind, waves, and current. The minor factors are water temperature and density.
Trim and shallow water (when operating in shallow waters) are major factors. The minor factors are hog/sag and rudder angle.
If vessels had a thrust measurement device then the propeller performance could be monitored (see left). However, if it is not available, then the engine efficiency can be tracked by observing the engine fuel input and shaft power output. The engine degradation can be assessed by tracking the shift in SFOC[3] curve – upward movement indicating degradation.

The key to understanding ship performance is to isolate the effect of environment and operations parameter and create a model where for a particular draft (or displacement) the speed-power or speed-fuel curve can be obtained.

In case of noon data model, the objective is to find the relationship between fuel or power as a function of speed, draft, and sea state. The variance from the prediction can be attributed to the degradation of the propeller, hull in case of using power. If fuel is used then engine degradation is also included.
Ships Reporting Noon Data
Ships historically reported their performance data on daily basis at 12 noon, using a report, aptly called noon report. As we can see the frequency of report is 24 hours. This means that many parameters that are instantaneous like speed, power are averaged for the whole period. We will discuss the issues in the next step.
As far as ship performance goes, only some of the major factors discussed above can be considered for analysis because the inherent error in the methodology is higher than the impact of the minor parameters.
Hence the following parameters are considered – Speed, Draft (displacement), Sea state. Let’s consider one by one.
Speed is reported as speed on water (using speed log) and speed on ground (using GPS). As far as performance analysis is concerned, the speed on water is what matters. This takes care of the effect of current. The average speed can be accurately determined. The only issue with averaging is the error because of the parameter being non-linear.

Average of power for two speeds is not same as power at average speed
As an example, the error in averaging of speed-power is shown above.
The draft can be obtained reasonably accurately using draft gauges. The draft does not vary significantly during the voyage and less so during a 24 hour period.
Sea state is one parameter that is reported by ship staff based on their observation of wind speed and visual observation of wave. This can have significant errors since it is usually biased to the period close to noon, just before reporting, instead of taking the average for 24 hours. There is a different issue with the error in taking sea state as representative for weather since only the wind speed is considered without taking into account its direction.

Comparison between model prediction (yellow) and observation (green)
These errors mean that a model based on noon data and sea state for the environment would have an accuracy of 85-90%.
When one corrects for draft (or displacement) while building the model using admiralty coefficient, which is using (displacement)(2/3) instead of wetted surface area ratio, there is a difference of 3-5%.
The human error for sea state can be eliminated by depending on real time weather service providers like IBM Weather to understand the sea state at various intervals, usually every 4 hours, and average taken for the 24 hours.

XShip Weather Dashboard using IBM Weather
The shaft power can be made more reliable if it is measured using a shaft power meter. The human error in fuel consumption can be avoided if we use digital flow meters.
Ships Reporting Realtime Data
There are two benefits of using real time data. The first is the removal of the error due to change in averaging over 24 hour period. Instead of 24 hours the period is now very short like 10 sec or a minute. The second benefit is using actual wind and waves to remove its effect and thereby getting a better estimate for the effect of environment.
The wind speed and direction for this are ideally taken from the ship anemometer. If it is not present, one can use the real time weather data. For wave data, the height and direction of the wave are obtained from weather data providers and the effect of the wave can be estimated.
The process for correction, modeling and prediction is described in the ISO paper[4]. One essential element before doing the wind and wave correction is to first estimate the effective power from the shaft power. For this we need propeller efficiency for each condition which is usually possible if propeller open water tests and ships model test data is available. If the latter is not present, we can estimate the wake coefficient, thrust deduction factor, hull efficiency from empirical formulas as good estimators.

Procedure for Correction, Modelling and Estimation
Conclusion
The human factors that can affect the ship performance analysis can be systematically removed using additional devices on board and getting reliable data from alternate sources. The former includes use of speed log for getting speed on water. The latter includes getting the environment data like average sea state for a day, wind, wave, and current information from real time weather providers.
[1] http://www.ics-shipping.org/shipping-facts/shipping-and-world-trade
[2] Martin Stopford, ‘Maritime Economics’
[3] Specific Fuel Oil Consumption
[4] ISO/DIN 15016, Ships and marine technology — Guidelines for the assessment of speed and power performance by analysis of speed trial data

Sandith Thandasherry
Founder, XShip Design and Analytics
The author is the founder of XShip Design and Analytics, a firm offering XShip suite of design and analytics solutions for the shipping industry. He is also the founder of Navalt Solar and Electric boats, the firm which build ADITYA, India’s first solar ferry. He is graduate in Naval architecture from IIT Madras and holds and MBA from INSEAD, France.
He runs two ventures: Xship – www.xship.in and Navalt – www.navaltboats.com
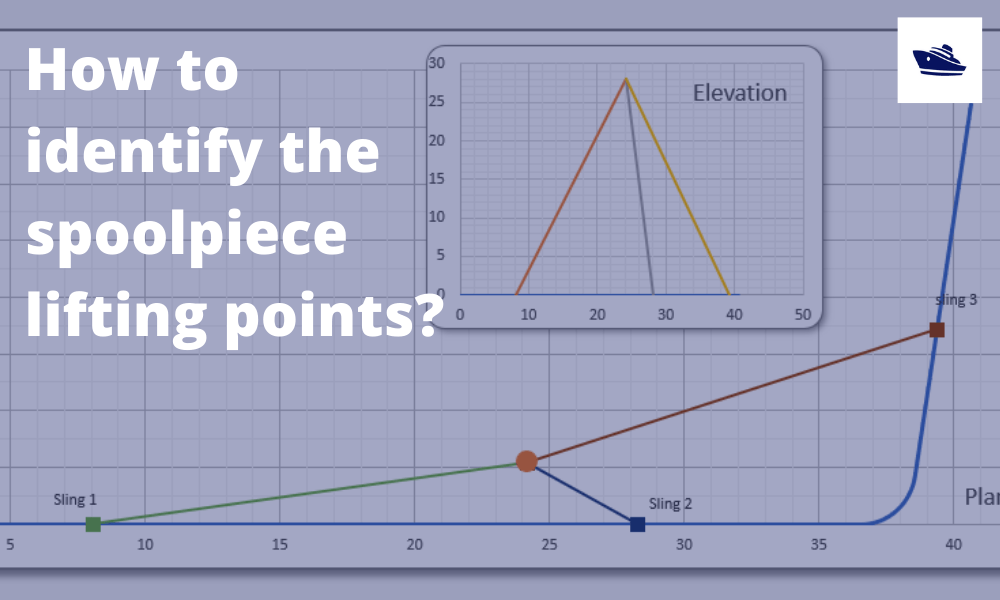
How to identify the spoolpiece lifting points?
In the offshore construction industry, the connection between the newly installed pipeline and the...

The importance of clear decision support before marine operations
Our oceans are interspersed with human activities: be it fishing, marine transportation, or...
Sea Pressure Loads Calculation based on DNV Rules
Introduction Sea pressure loads are an important factor in the structural design of a...
A quick empirical method for resistance estimation of planing vessels
Resistance estimation for a vessel is a fundamental exercise in design of the vessel. Resistance...
Powering the maritime industry with Hydrogen – Part 2
Powering the shipping industry with hydrogen - Part 2: Hydrogen propulsion on a ship -...
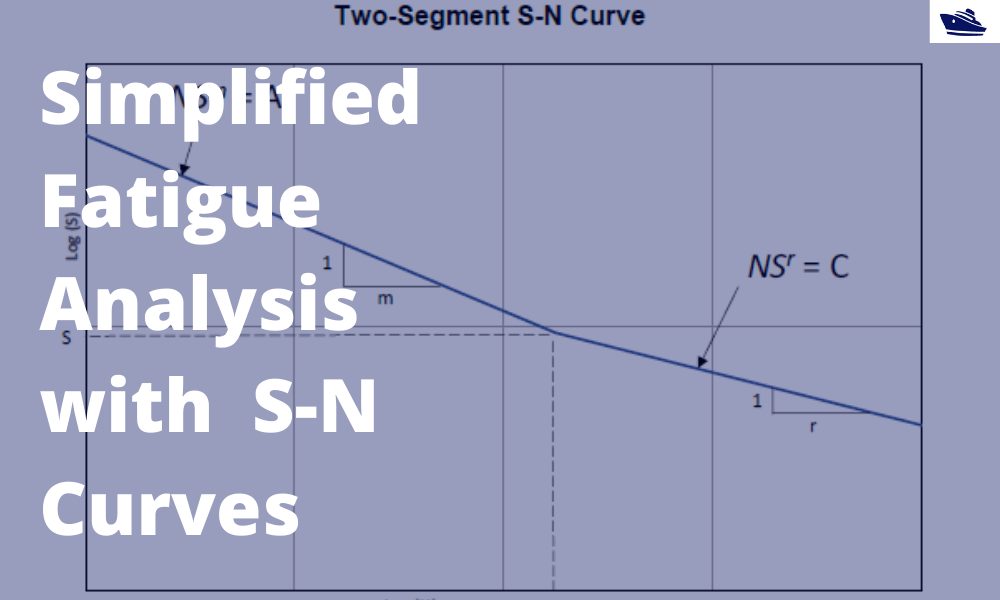
A simplified method of performing fatigue analysis of offshore structures
A simplified method of performing fatigue analysis of offshore structures Introduction An...

Powering the shipping industry with hydrogen: opportunities and challenges (Part 1)
Part 1: About Hydrogen – Basics, Opportunities, and Challenges Of late, hydrogen has been...
The importance of analysis in nearshore pull-in operation in offshore wind farms
Introduction Over the last 10 years, the global wind energy business has increased manifold. In...
Vessel Draft Survey Accuracy
by Chris Zeringue, Owner, MTS Marine Techincal Surveyors ...
How to use a ship’s hydrostatics to calculate its draft and trim
Introduction A ship’s hydrostatics, or hydrostats, is an oft used term in maritime parlance, and...
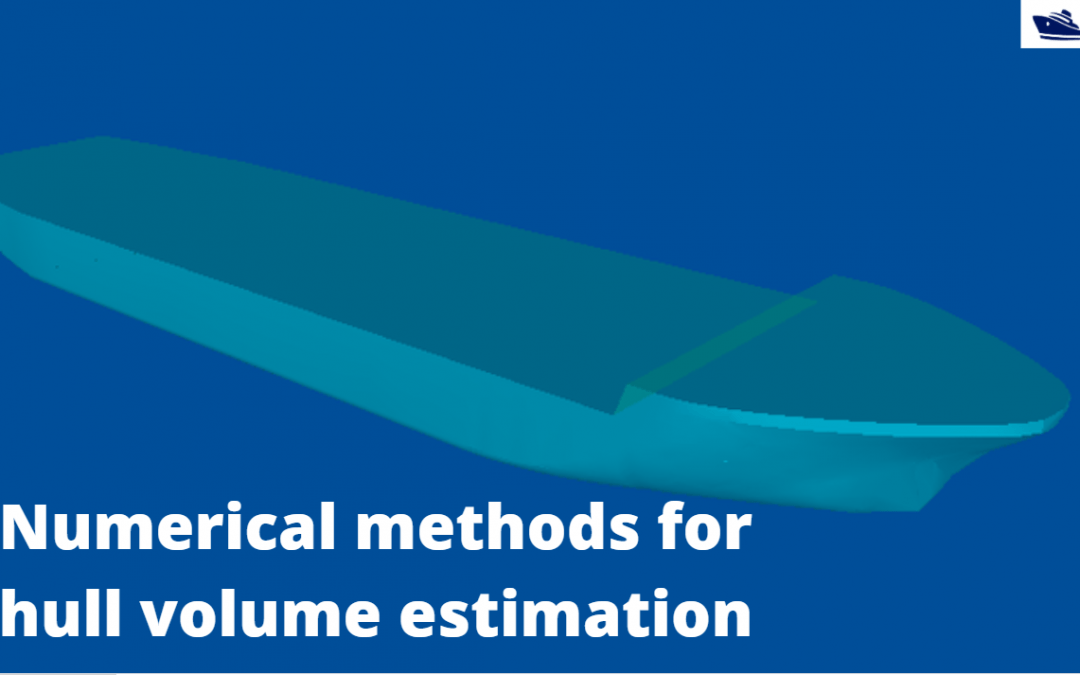
Numerical integration methods for hull volume estimation
Introduction The hull of a ship is a complex 3D geometry, and finding out its simple properties...
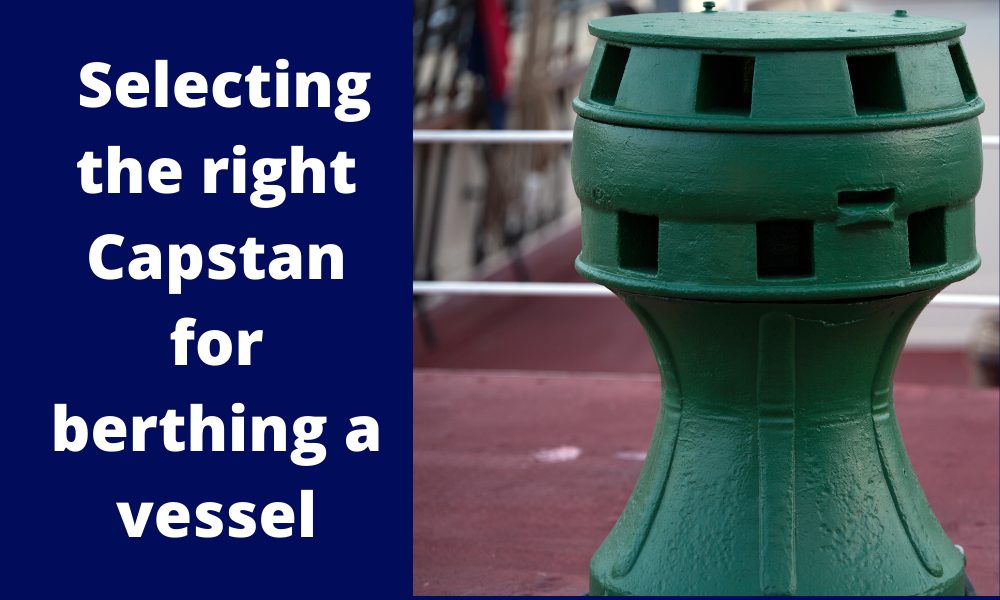
Selecting the right Capstan for berthing a vessel
Introduction Capstans are frequently deployed mooring equipment used on all types of vessels....
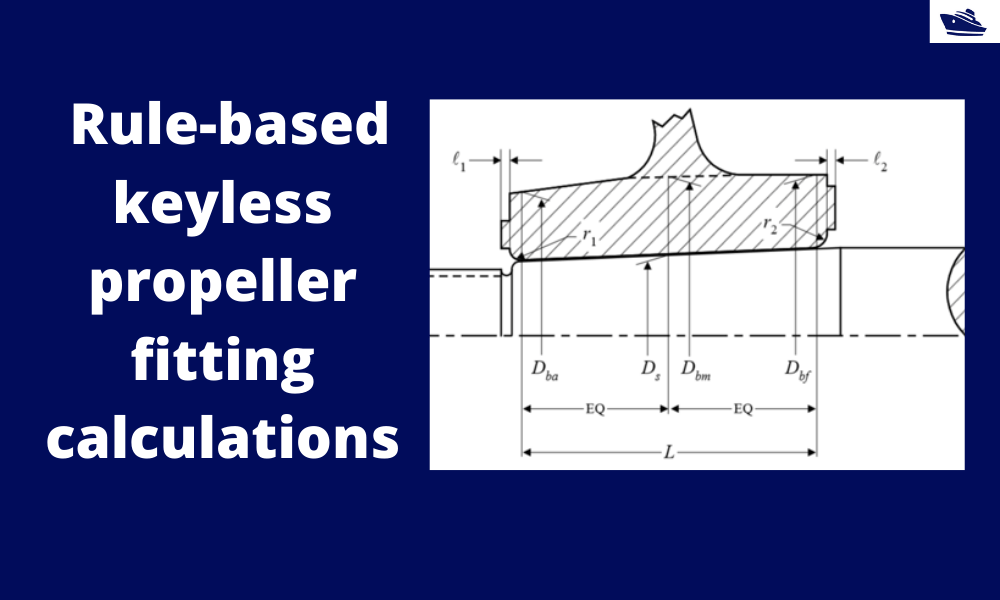
How to do rule-based fitting calculations of a keyless propeller
Introduction A keyless propeller, as the name implies, requires no key for fastening the propeller...
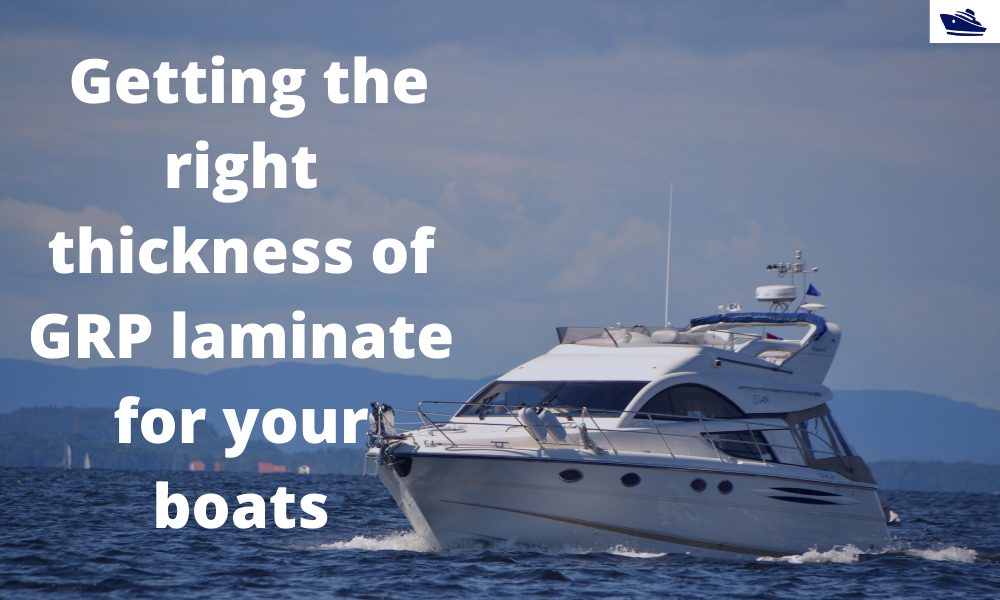
Getting the right thickness of GRP laminate for your boats
Introduction GRP laminates are widely used in the fabrication of high-speed crafts and light...

Designing Fillet Welds for Symmetrical Joint Sections
Introduction Fillet welds are the most commonly used weld types in marine structures. A fillet...


Many tkanks