A simplified method of performing fatigue analysis of offshore structures
Introduction
An offshore structure is subject to environmental loads of waves, wind and current. By their nature, the resulting wave loads on the structure are cyclical. These cyclical loads result in cyclical stresses on the structure too. Over a short period of a few months, this cyclical variation of stress doesn’t affect the structure, but over the lifetime of the vessel, constantly experiencing cyclical stresses may lead to cracks in the structure. This phenomenon is called ‘fatigue cracking’. It is estimated that over a lifetime of 20 years, an offshore structure will experience 108 cycles of stress.
In some cases, the vibrational loads of the structure may also result in fatigue. Usually, it is the welds which develop the cracks first that then propagates to the rest of the structure.
In this article, we’ll discuss a simplified method for performing fatigue analysis of offshore structures using American Bureau of Shipping (ABS) Guide for Fatigue Assessment of Offshore Structures (June 2020).
Fatigue Demand and Fatigue Strength
The key concepts here are Fatigue Demand and Fatigue Strength. The former is the amount of stress that the structure experiences due to the variable loads, while the latter is the capacity of the structure to withstand fatigue loads. If the fatigue strength is more than the fatigue demand, the structure is safe.
Since the load varies, the stress too varies about a mean value. The fatigue demand is calculated in terms of stress ranges that the structure experiences. The best way to calculate Fatigue demand is through a thorough structural analysis
Another important concept is that of Stress Concentration Factor (SCF) which is a factor introduced to take care of the localized rise in stress in a structure due to local geometrical variations (like a rat hole in way of the connection)
S-N Curves
Since fatigue is a result of cyclical stress, it will be useful to know how many cycles of stress a material can withstand under a certain stress range before it fails. This is the approach adopted by the S-N curves method. S-N curves are plots of stress range versus the number of cycles to failure for a material. These curves are plotted based on experimental tests done on specimens.
The general relationship between the Stress Range (S) and the number of cycles to failure (N) is given by:
N = A ∙ S–m
Here, A and m are ‘fatigue strength coefficient’ and ‘exponent’ respectively and are determined from tests. Usually both N and S are displayed on logarithmic scales.
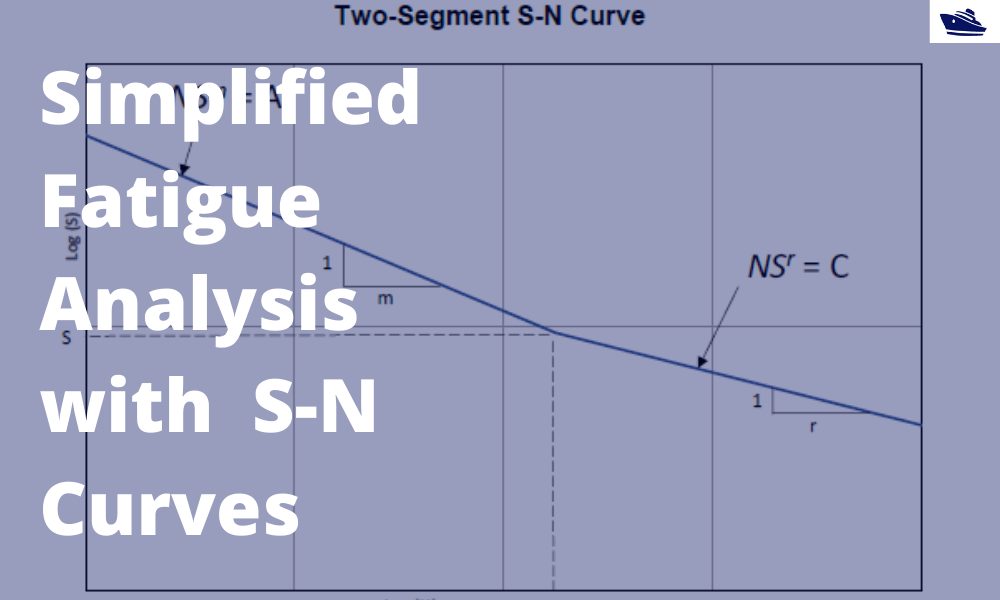
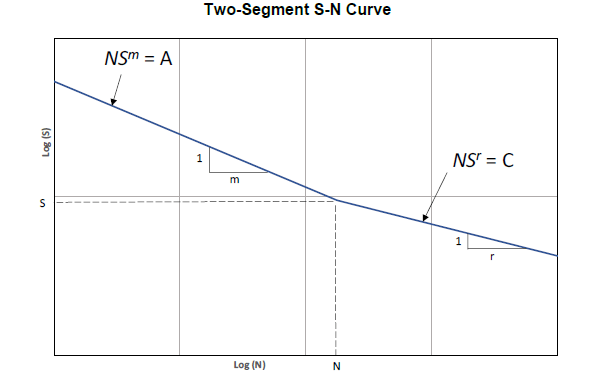
In the approach used by ABS Guide for Fatigue Assessment, two-segment S-N curves are used. They look like the below:
A consideration in these calculations is that linear cumulative damage (as in the Palmgren-Miner method) applies.
Further, the S-N curves are presented according to the ‘class’ of the geometrical details of the structure. There are eight such nominal classes: B, C, D, E, F, F2, G, and W. The details of these classes can be found in APPENDIX 1 of the ABS Guide on Fatigue Assessment of Offshore Structures.
The following parameters are obtained from the S-N curves:
- Fatigue Strength Coefficients, A & C
- Fatigue Strength Exponent, m & r
- Stress range at slope change, Sq
- of cycles at slope change, Nq
Fatigue Load Cases
When carrying out fatigue assessment of an offshore structure, one vital input is the environment in which the structure will be operating. Since waves are the primary cause of cyclical stress on a structure, the fatigue analysis needs to be performed for the environment loading history that the structure will experience during its lifetime.
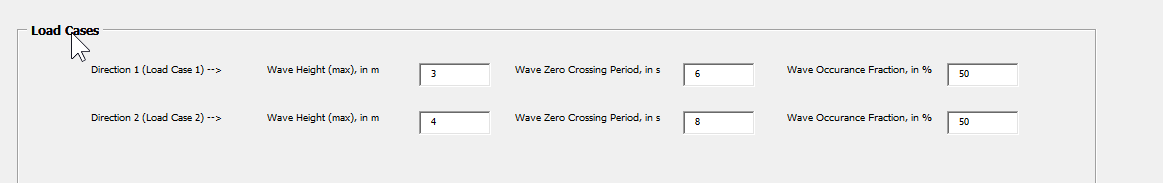
There may be multiple environments throughout the lifetime of the structure, and each will contribute to the assessment. Each environment case will be characterized by its significant wave height, the zero-crossing period and wave occurrence fraction. The ‘Wave Occurrence Fraction’ represents the percentage of time that the structure encounters a specific load case. So, basically it is the contribution of that fatigue case towards the total fatigue damage. The sum total of wave occurrence fractions for all fatigue load cases should be 100. The load cases may look like this:
Weibull distribution:
The loading history is represented in probabilistic terms by a probability distribution function. Weibull distribution most effectively define loading data on offshore structure.
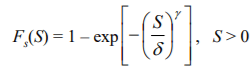
In the simplified fatigue assessment method, the two-parameter Weibull distribution is used to model the long-term distribution of fatigue stresses. The cumulative distribution function of the stress range can be expressed as
Fatigue Assessment
The fatigue assessment involves calculating the individual fatigue damage for each load case, and then adding them up together to give the cumulative fatigue damage of the entire structure.
The steps for calculation of individual fatigue damage are shown below:
- The stress range on the structure is a user input. The stress is obtained for a representative wave environment and with FEA.
- Factor the stress range for the Stress Concentration Factor (SCF) and thickness correction factor to get the modified Reference Stress range.
- From the design life of the vessel, calculate the total number of cycles for design life, NT .
- The Weibull shape (γ) is obtained from experience. From the reference Stress range calculated in Step 2, calculate Weibull scale parameters (δ).
- Select the appropriate SN Curve Class for the assessment depending on the structure type and location.
- For the two sections of the S-N curve, calculate the parameters A, C (Fatigue Strength Coefficients) and m,r (Fatigue Strength Exponent), along with the stress range at slope change, Sq.
- Calculate the Fatigue Damage for the Load Case using the formula:
.D = NT*(g^m)/A*G(a)
where,
a = m/g + 1, and G(a) is the corresponding Gamma function for the value ‘a’, defined as
- Factor the individual fatigue damage of the two sections of the SN curve for the ‘wave occurrence fraction’ and calculate the Fatigue damage of the Load case by adding the fatigue damages of the two sections.
Cumulative Fatigue Damage
Once we have the fatigue damage calculated for each individual load case, we can calculate their cumulative damage by summing up the damage inflicted by environment bins. If the cumulative damage exceeds the required damage with a requisite safety factor, then failure is predicted to occur.
That was a summary of Fatigue analysis of offshore structures using S-N curves based on ABS rules. The calculation itself can be performed using a spreadsheet development. Please do check out TheNavalArch’s own product for performing fatigue analysis.
References
https://www.fatec-engineering.com/2018/02/20/description-of-a-s-n-curve/
https://www.sciencedirect.com/topics/engineering/s-n-curve
https://community.sw.siemens.com/s/article/what-is-a-sn-curve
ABS – GUIDE FOR FATIGUE ASSESSMENT OF OFFSHORE STRUCTURES JUNE 2020
Disclaimer: This post is not meant to be authoritative writing on the topic presented. thenavalarch bears no responsibility for the accuracy of this article, or for any incidents/losses arising due to the use of the information in this article in any operation. It is recommended to seek professional advice before executing any activity which draws on information mentioned in this post. All the figures, drawings, and pictures are property of thenavalarch except where indicated, and may not be copied or distributed without permission.
The four important factors for a ship’s windage area calculations
Introduction The windage area of a vessel or offshore structure is the area that is exposed directly to the wind. As is obvious, this is the area of all items above the waterline. This will include Part of the hull/offshore structure above the waterline...
Calculating the maximum stacking height of pipes
Introduction Pipes (or linepipes or joints) are used for multiple purposes and locations in the maritime/offshore industry. Onshore and offshore pipelines are used for transportation of fluids on land, over and underwater. Pipes are fabricated in an onshore facility...
Safe Towing: Calculating a towline’s catenary and sag
Introduction Towlines connect a tug to the vessel being towed and are defined by multiple characteristics like Weight, Diameter, and Stiffness. The tension in the towline during the towing operation is not static but keeps varying with the distance between the tug and...
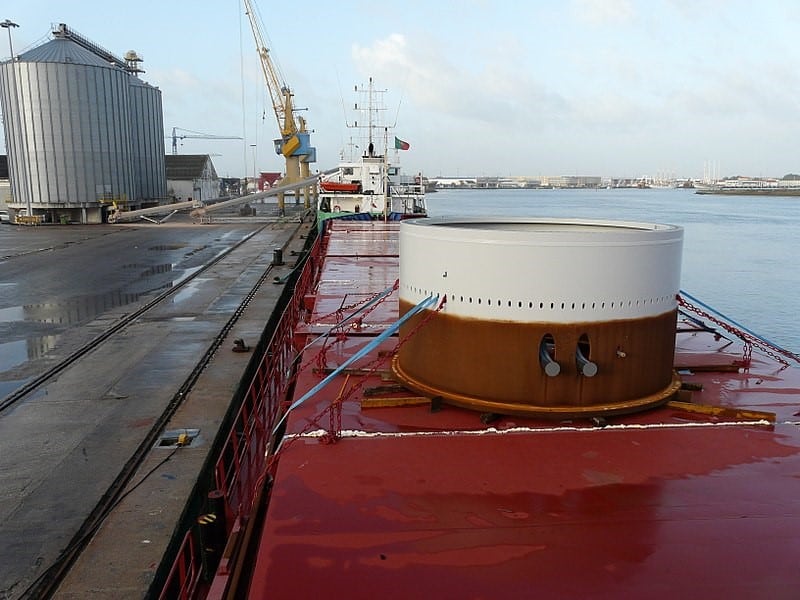
Designing the lashings of deck cargo using IMO CSS
Introduction More than 70% of the earth is covered by water, which makes shipping historically the easiest and cheapest way of connecting manufactures and customers across the globe and can be reasonably considered to be the artery of the global economy....

Using MS Excel to evaluate the Stability of existing Barges
Barges are the simplest, and yet most widely used of marine vehicles. They are used for a variety of purposes ranging from carrying cargo in bulk or liquid, to even carrying passengers for short inland cruises. Barges are mostly towed by another barge called a tug,...
Calculating forces on a ship’s deck cargo – a simplified approach
A cylindrical deck cargo (Source: Wikimedia) Introduction A ship’s deck is used to transport many different types of cargo – from containers to large structures like cranes or heavy modules of an offshore production plant. During transport, the ship suffers from...
Designing a pad-eye: little items with big intricacies
Pad-eyes are one of the smallest and most universally used structural items in the maritime and Oil & Gas industry. They are used for a variety of purposes too: from a simple seafastening of a cargo to deck of a vessel, to complicated lifting operations involving...
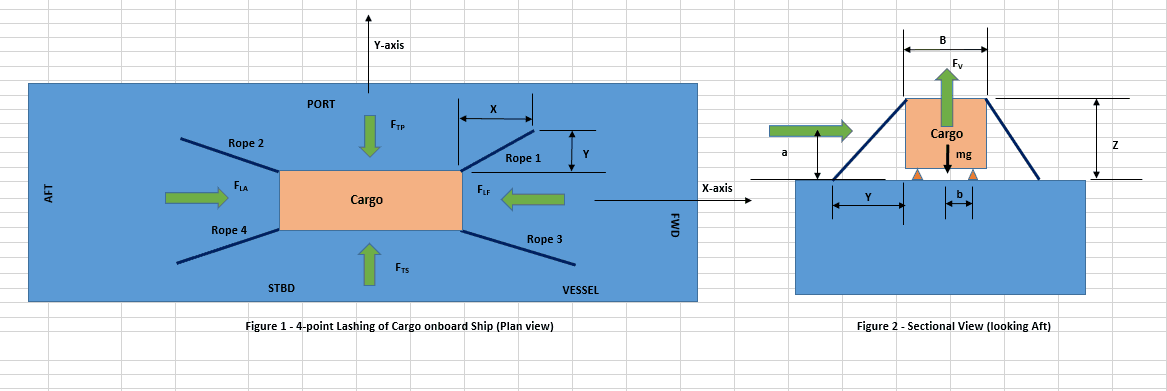
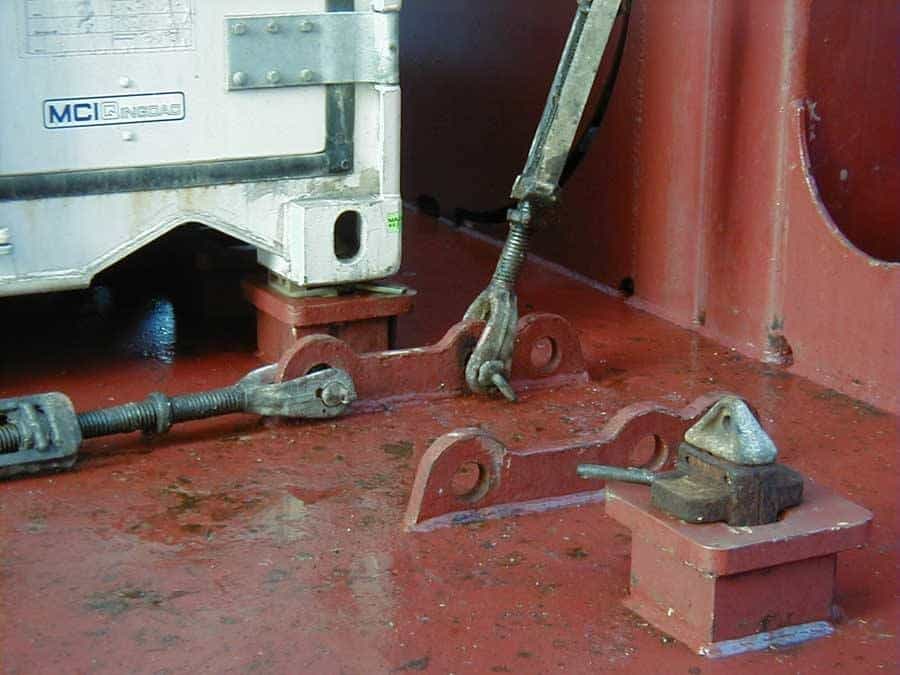
Designing a simple 4-point lashing system for a Deck Cargo
Introduction Lashing of a deck cargo on a ship involves different means and mechanisms to secure the cargo to the deck of the ship. This ‘securing’ is important to contain the movement of the cargo in view of the ship motions during the transportation. The simplest...
Selecting the right equipment for towing operations – Emergency Towing
In Part 1 of the article, we discussed the regular towing arrangements and how to select the towing gear for the same. In this part, we will discuss the components of the emergency towing arrangement and how to select them. The purpose of emergency towing equipment is...
Selecting the right gear for towing operations – Part 1
Towing operations seem pretty straightforward – we just need to connect the vessel to be towed to the right sized tug and get started! However, a simple exercise of digging deeper will reveal critical items that we need to take care of. If we start thinking about the...
I am very much interested
Please send.
Interested topic; I am interested in load definition collective. Thank you
please send me
Please send article